All posts
UX Research Topics
Podcasts
Field Guide
SUBSCRIBE TO OUR NEWSLETTER
We asked over 300 user researchers what their research practices looked like, how their teams were laid out, and what they earned.
User research is on the rise. Bold statement, right? Not really. From 1983 to 2017, the UX profession grew from 1,000 to 1 million, according to NNg. From 2017 to 2050, they estimate it will grow to 100 million strong. When we made our map of user research tools, we documented 50 tools devoted entirely to helping companies learn more about their customers, 64% of which didn’t exist 10 years ago. Search intent for “user research” has risen 4.25x in the last 10 years.
Today, the world of user research is full of curious people helping companies learn more about customers. From our quick research, there are at least 15 online communities devoted specifically to user research, with over 85,000 members. Since we can’t comb the whole internet for UXR communities, those numbers are likely higher! There are currently over 54,000 full time jobs with the keyword “user research” listed on Indeed, plus over 16,000 on Linkedin.
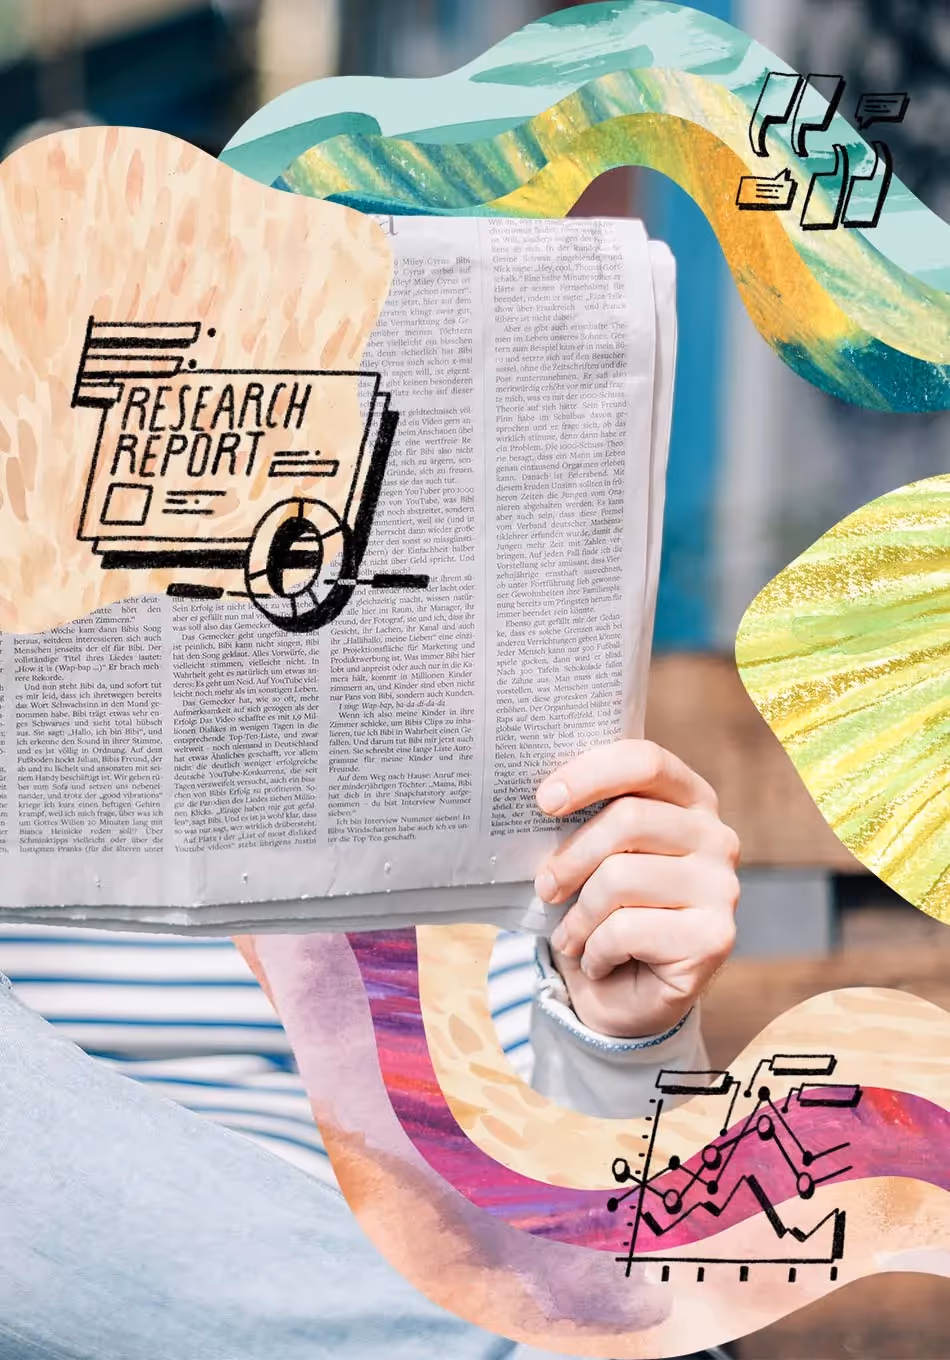
We surveyed over 300 researchers and people who do research for our biggest State of User Research yet. We’ll share ALL the details in this 113-page report, but here are a few of the highlights that stood out to us.
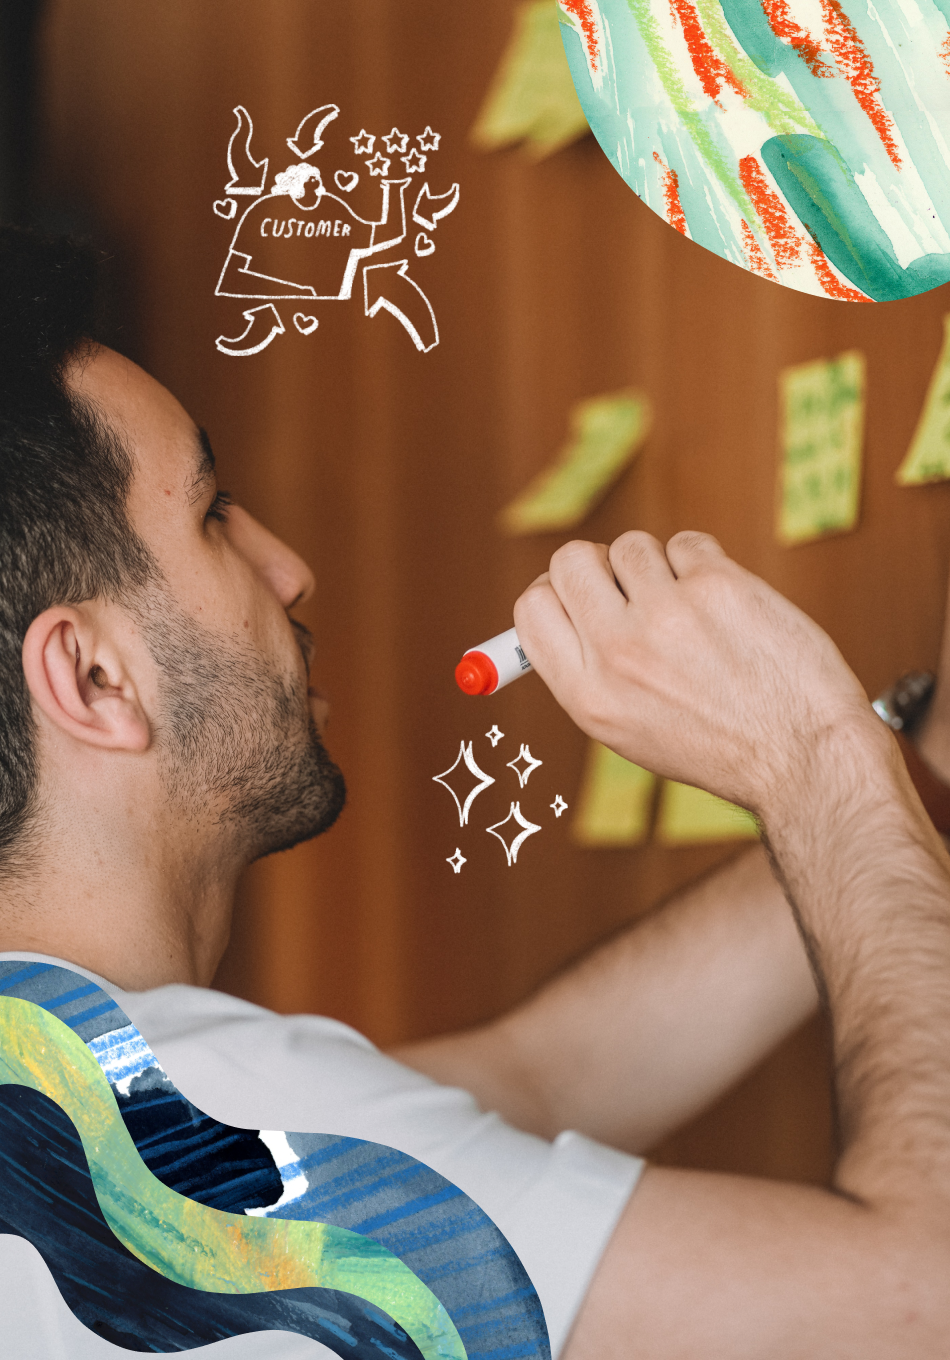
This year, we heard from more people doing research earlier in the product development cycle. It's exciting to see this change, especially since it’s a sign that teams are using research to develop new ideas rather than validate their existing ones.
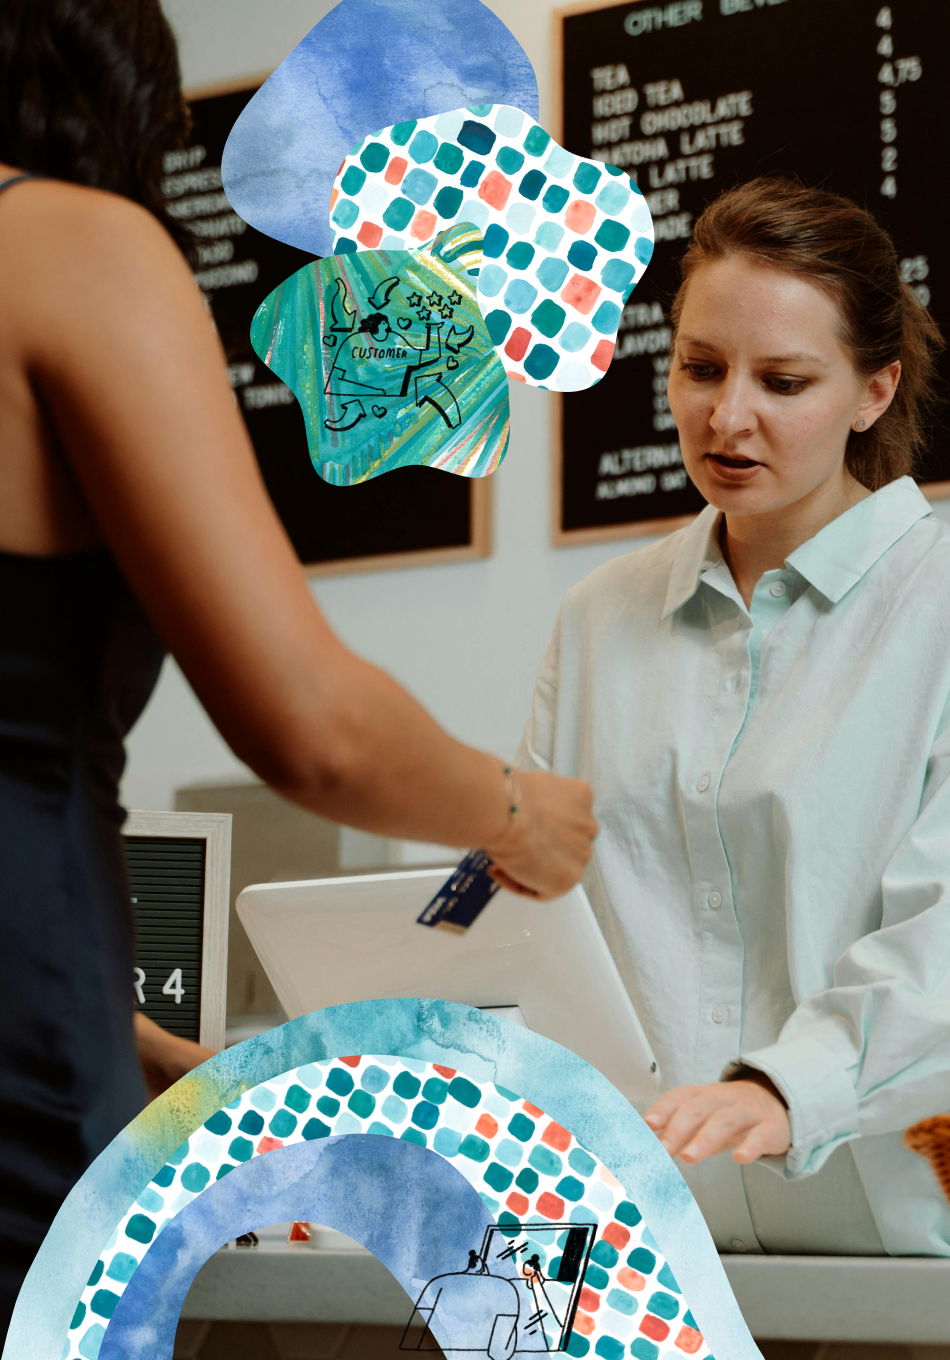
43% of researchers say their favorite thing about research is making decisions with better evidence. With 93% of researchers conducting research before designing anything there’s more evidence gathering before any designs are made. We also heard from more people compared to last year who are doing research throughout the product development cycle (56%), which is a good sign that research is an important part of each stage of the process.
Stakeholder buy-in is so important to how much impact research can have within an organization. But most of our respondents said less than 40% of stakeholders knew how to access research findings. They also listed stakeholder buy-in as one of their biggest frustrations in their current jobs.
We found that in organizations where more stakeholders had access to research findings, researcher’s felt their work was more effective and important to the organization. We hope to see stakeholder access and buy-in grow in the coming years!
Researchers used a variety of methods to get the job done. The most popular were user interviews, moderated usability tests, surveys, and field studies. But most researchers (82%) used 4-7 methods a month to learn more about their users.
Last year, this number was 75%, so even more researchers want even more research this year. There’s always more to understand about your users, so it’s no surprise that researchers want to be doing even more research.
1. Who did we ask about user research practices?
2. Why do you do user research?
3. How do you plan for user research?
4. When in the product development cycle do you do user research?
5. What kind of user research is happening?
6. Who is participating in user research?
7. What tools are you using to make user research faster, easier?
8. What do research teams look like?
9. How does user research work in organizations?
10. What’s a typical budget for user research?
11. What do user research jobs look like?
12. How effective is user research?
13. How do researchers stay up to date with what’s going on in their industry?
14. What do we want to see more of in the coming decade?
15. Conclusion
This year, we nearly doubled the number of people who participated in our survey. We heard from 336 people who spend more than 10% of their time on research, compared to last year’s 169. Since who we hear from plays a huge part in what we hear, we want to take a moment to talk about our respondents, how they compared to last year, and the factors that play a role in how they responded to our survey.
We heard from a more diverse set of respondents than we did last year, with 33 countries represented compared to last year’s 17. 53% of the respondents were from the US, 10% were from the UK, and 9% were from Australia. In fact, if you tried to visit every respondent from our survey, it would be a whirlwind journey around the world over 42,000 miles long.
Most of the respondents to our survey identified as female (67%), while 30% identified as male. The remaining 3% identified as non-binary or preferred not to disclose that information. This lines up with the general landscape of UXR. Data from Payscale shows nearly identical gender breakdowns among User Experience Researchers.
Like last year, most of our respondents (65%) held graduate degrees. 32% had completed undergraduate degrees as their highest level of education. 11% held additional certifications, in things like design and UX.
We saw differences in the companies our respondents worked at this year, which may explain the differences between the two reports. We heard from more people working at bigger, enterprise companies on bigger dedicated research teams.
Overall, we heard from 13% more respondents who worked at enterprise companies and 9% less who worked at startups compared to last year. Since the plurality of our respondents last year worked at startups, and the plurality this year work at enterprise companies, we’re hearing from more people with more established research programs, working in bigger teams and companies.
We also saw an uptick in people working in bigger companies, likely due to the uptick in enterprise employees. We heard from 7% more respondents who worked in companies of 10k+ people, and 3% more who worked in companies of 5-10k people. On the flip side, we heard from ~2% less people who worked in companies of 1, 2-9, 10-49, and 50-199 people.
We heard from more people who worked on bigger dedicated research teams, from teams of 2-4 researchers to 21+ researchers.
Last year, we didn’t collect data on where our respondents found our survey, though we did distribute it in a similar way. This year, we tracked where respondents found our survey, and how many people from each place completed the survey.
We found that a whopping 70% of our respondents found the survey through online social communities. Most of these communities were focused entirely on user research, and the ones that weren’t focused on things like general UX, product management, and UX design. Only 21% found our survey through User Interviews owned channels, like our email list and our social media. We did not distribute the survey to our internal participant database. We’re thrilled to hear from the UXR community at large, not just our corner of it.
The plurality of our respondents, 38%, spent almost all of their time on research. But UXR reaches beyond dedicated user researchers, and 62% of our respondents didn’t spend all their time on research.
We heard from designers who talk to users as part of their design process, founders hustling to talk to more customers on the hunt for product/market fit, and engineers searching for more context for their code. Because our audience varied in how, when, and why they do research, we’re calling our respondents People Who Do Research, or PwDR for short. We borrowed the term from Kate Towsey, one of the leaders of the Research Ops movement. We think it best describes the people who participated in our survey, since not everyone was a full-blown user researcher.
Back to Table of Contents
If you’re reading this, you’re probably already pretty on board with what user research can do for teams and products. So we wanted to dig a little deeper into what specifically teams love about user research.
Our PwDR’s favorite thing about user research by far was making decisions with better evidence, with 43% of the overall vote. Not surprising, considering it also ranked #1 last year and is the most tangible benefit of research.
We chatted with Caitria O’Neill, Senior UX Researcher at Google, about what makes a good research report. She talked about the importance of bringing tangible information about users and their choices to the top of stakeholder’s minds. She also stressed the importance of putting important information in context, so the team can make better decisions about the final product.
[A research report] needs to teach the team valuable information. So...the goal was to figure out, does this work for the user? The report comes back and says no. But, that doesn't give anyone more information on what to do about it. What didn't work? What about it didn't work? If it was changed in X, Y, or Z way, what would that mean for this whole design all together?
We also asked PwDRs about what the main goal of their research program is. Like last year, they rated understanding customer need as the main goal of their user research program. It earned an average score of 6.1/7 in terms of importance to PwDRs.
Taking the #3 slot with a rating of 4.2/7 is voice of the customer and internal education. In 2011, Forrester announced we had entered a new age, the “age of the customer.”
“The only source of competitive advantage is the one that can survive technology fueled disruption — an obsession with understanding, delighting, connecting with, and serving customers. In this age, companies that thrive are those that tilt their budgets toward customer knowledge and relationships.”
Forrester’s Age of the Customer Report
Since 2011, UX, CX, UXR, and everything in between has become increasingly important at companies of all shapes and sizes. With it, PwDRs have become a voice for users, and have learned to love it too! They listed bringing the voice of the customer to the team as their second favorite thing about user research. With 31% of the overall vote, PwDRs enjoy being able to help stakeholders understand what customers are saying and experiencing.
“One of the things that I found extremely useful on a much smaller scale, just showing actual videos of people experiencing problems. Showing it to [stakeholders] and saying, this is what you're making people do, this is what you're making people go through.
I remember bringing [developers] into user research sessions, having them sit behind me. One of the engineers just fixed a bug during the usability session because he just couldn't stand seeing it happen. It made it real for him. That bug had been around for like four years. Don't underestimate the power of just making the people who make these decisions aware of the problems.”
Laura Klein, author of UX for Lean Startups and Build Better Products.
Voice of the customer programs go beyond helping teams empathize with users. They can also make people feel like their job has more impact and meaning. According to a report by SurveyMonkey, “among employees with a great deal of customer empathy, 76% find their jobs meaningful. Among those with low customer empathy, only 49% find their jobs meaningful.” By being that voice and helping teams grow their empathy for customers, PwDR are also helping increase the fulfillment others feel at work.
Moving forward, the desire to hear the voice of the customer is more common than not. In a report by Forrester, only 20% of companies ranked as “customer-naive”, which they defined as “demonstrating customer-centricity in isolated pockets only.” The rest of the group ranged from “customer-aware” to “customer-obsessed.” Prioritizing customer goals and sustaining focus on them is a big factor in moving up the ladder from “customer-naive” to “customer-obsessed.”
Validating solutions is also important to PwDRs, whether it’s in the early or late stages of development. Validating early stage solutions (like prototypes and mockups) ranked #2 in terms of important research goals, with a 5.4/7, and validating late stage solutions (live experiences) ranked #4, with a 3.9/7.
This is consistent with when PwDRs are most likely to conduct research. 93% said they conducted research before the design and prototyping even began. This is a great thing. Research before design means more teams are thinking about how to deeply understand their customers before they try to build solutions. They’re not just validating their ideas, they’re taking time to learn and brainstorm before creating anything.
Even if it’s not the main goal of their research program, we found that 93% of PwDRs use at least one research method to validate their solutions. This includes things like usability tests, tree tests, and first click testing.
In real life, there are many different ways teams can use research to validate solutions. We (User Interviews) use usability testing throughout our product development cycle to test new features and ensure users understand existing features. FYI uses early access programs to validate live solutions and fine tune their product. Pluralsight uses customer preference testing to ensure they’re on the right track with their prototypes.
At the end of the day, PwDRs are in the field because they love user research. Spending time learning about others, being a voice to the potentially voiceless, and digging into the hard, human problems that come with building new things makes user researchers love what they do.
When we asked PwDRs what their favorite things about user research were, we left an open text field. Here’s what some people loved about user research:
“Uncovering the things that surprise stakeholders—whether it's learning something we had no idea about or never thought to ask about, or in some cases invalidating assumptions people have (especially the ones that seem like common sense but we turn out to be wrong about)”
“Crafting research questions and strategizing the best way to gather information”
“Shifting decision making from personal opinions and perspective to interpreting what users say, do, need and want. Users are a neutral third party that everyone can get behind”
User research is so much more than bringing the voice of the customer to your team, validating your solutions, or making informed decisions. It’s taking the time to listen to people who have something important to say. It’s keeping the focus on the people you’re doing the work for. It’s practicing empathy at the highest level, and bringing others along for the ride.
Back to Table of Contents
User research is a big undertaking, and PwDRs typically spend time sitting down and planning their research before launching their projects. We looked into when they planned, how they recruit participants for studies, and what kinds of studies PwDRs are doing.
When PwDRs plan for research, they usually try to plan in advance. When we asked how far in advance PwDRs planned a typical research session, 32.3% said they planned 1-2 weeks in advance. This was followed closely by the 31.8% that said they started planning 3-4 weeks ahead of time.
Super early stage planners, who had research on the roadmap for months ahead of time, were the least common, making up only 6% of all PwDRs. This may be because user research is always acting with the evolution of your company, product, and customers. You may not even know what questions you’ll want to ask in six months, or how you’ll want to ask them. New research may spur on new questions, products may take unexpected twists and turns, users may say things that completely surprise you, and that’s all part of the fun.
“When we do a lot of user research, it's easy to feel confident, be like, ‘Oh, I know my customers. I'm learning what they need.’ But if you do user research well, and you always cultivate this mindset of what is surprising me in this interview, you will always find something that is surprising, that no matter how much research we do, no matter how much time we spend with our customers, we can't completely know them. And I feel like the goal of user research should be to find those moments. And so I love them because it's just a good indicator that you're doing your research well.”
Teresa Torres, founder of ProductTalk.org
Typically, researchers start recruiting later in the process. The plurality of PwDRs, 30%, started recruitment 1-2 weeks before research, though the rest of the responses skew closer to the session than the planning did.
We found that the plurality of our PwDRs started recruiting right after their planning had started. So, 48% of PwDRs who said they started planning 2-4 weeks before a typical session said they started recruiting 1-2 weeks in advance, and so on.
Since you don’t really know who you’ll need to talk to before you know what research question you need to ask, this makes sense. We’re happy to see researchers taking the time to plan for their studies before sending out calls for participants! Plus, with an average of 2 hours to your first qualified participant, User Interviews can help you recruit the right participants for your study in a snap. We’ll even give you three free participants for your first study.
Research studies are as special and unique as the problems they solve. The majority of our PwDRs said more than 51% of their studies were unique, meaning they weren’t ongoing, recurring, or templated studies. This means researchers are evolving and adapting their studies to the problems they’re trying to solve, using different methods, audiences, and approaches.
“Can I say that [the research] is finished? Well, I did the final presentation. In a certain sense, yes, yes it is. It’s all wrapped up. It’s all good to go. I mean, did we have 10 million other questions at the end of that research? We sure did. We had to close the door on that specific research round, because of time constraints and bandwidth and all kinds of other things. I think that there is tremendous value in allowing your team to have the kind of freedom to carry the research forward in other directions and in other research rounds, either formally or informally. It’s never really done. It’s never really done.”
Cat Anderson, UX Writer at AP Intego
Back to Table of Contents
This year, most researchers (93%) said they conducted research before designing and prototyping. This is a change from last year, when the #1 slot was held by researchers conducting research during design and prototyping.
We’re elated to see that more people are taking the time to do research before they design anything at all. It signals a shift towards user research as a tool to ideate rather than validate. By doing research before designing or creating anything, PwDRs are taking the time to learn from their users and using that information to inform what they build.
Beth Koloski, who runs the Denver Innovation Company and has over 20 years of experience working with user-centered design and research, said the ideal research cycle starts with generative research. This is research that happens before the team builds anything, and helps teams keep the focus on the user, rather than the solutions they want to build.
“Without a doubt, the biggest common mistake is that the focus inevitably becomes product or company-centric. People have the desire to learn, but it gravitates around their own stuff. So they start research with the aim to discover which features are important to users, or what people are prepared to pay more for. But all of this comes from the perspective of benefiting the company or the product...The ideal method is to first do generative foundational research, then come back together as a product team to unpack the results and co-create possibilities.”
We’re also happy to see PwDRs doing research throughout the product development cycle. 56% of our PwDRs said they did research at every stage. Keeping users front and center throughout the development cycle ensures that you’re building the right solutions.
Conducting research throughout the cycle may sound like a lot of work, but if you implement a continuous research practice, it doesn’t have to be. Blocking off just thirty minutes to chat with a user each week can go a long way in terms of your team’s understanding of customers. Combine that with an automated research process that magically fills your schedule with participants who want to chat about your product, and you’re already learning more about your users and their needs, each week.
“As long as you treat research as a special, inessential activity, you will never find the time for it. When you embed asking questions, gathering evidence, and considering what it means into how your team makes decisions as a matter of course, you will wonder how you ever got along without it.”
Erika Hall, Co-founder of Mule Design and Author of Just Enough Research.
Back to Table of Contents
User research is a broad term. It could mean a designer running a usability test to iron out the flaws in a wireframe, a product team running generative interviews to understand a user problem, or a dedicated researcher running a field study to understand how users interact with a product in real life.
Because research means different things to different people at different times, we wanted to learn more about exactly what kinds of research PwDRs are doing.
We asked PwDRs what kinds of things their company typically researched and 97% said their company’s research was about digital products. Coming second was customers and ongoing customer research, which earned 72% of the vote. Both of these are higher than last year, and we’re happy to see more people researching their products and their customers.
While we’d love to hear more from people who do physical product research, only 28% of our PwDRs said they conducted research with physical products.
What we’re really excited about though, is more people combining customer research with product research. Of people who researched physical products, 83% also conducted customer research. Of people who researched digital products, 71% also conducted customer research. This is an increase from just 68% who researched customers and products, either digital or physical, last year.
This is a part of the movement towards using research to ideate instead of validate. By researching customers as well as products, PwDRs are learning more about the customers they’re designing for rather than using research as a tool to check that their existing ideas about customer behaviors are right.
Not every research method can help you answer every question, which is why it’s no surprise that 96% of PwDRs conduct more than one type of research in a typical month. A diary study helps researchers learn about behaviors over time, card sorts help uncover how people categorize things, and usability tests help PwDRs learn about how users interact with designs.
Overall, researchers were using each method about as much as they were last year, with user interviews being the most popular method. We can see both moderated and unmoderated types of research in the top five methods, boding well for a mixed methods approach.
Though most people were conducting research with more than one method, we found that 9% of superpowered PwDRs used all 10 methods. The sweet spot was between 4-7 methods, accounting for 82% of our PwDRs.
This makes sense; every method is not a good fit for every research question. Erika Hall, co-founder of Mule Design and author of Just Enough Research, talked to us about the importance of choosing the right method for the right research question.
“I think the biggest thing people get wrong is starting with their objective...people get it backwards. People say, "Oh, we're going to run a survey. What should we ask?" They don't stop and say, "Okay. What do we actually need to learn in order to inform a decision?" [Start by asking,] "What do we need to know, and what's the best way to find that out?"... That has to be really, really well-defined.”
We’re happy to see PwDRs using a variety of research methods to answer their research questions. Hopefully this means they’re taking into account which method is best for which question and getting the best insights they can.
We also found that PwDRs are, on average, conducting ~45 research sessions per month. That’s a whole lot of research!
P.S. If you’re a power PwDR, check out our unlimited subscription plans. They offer unlimited recruiting for the price of just 6-10 sessions a month. So if you’re conducting anywhere near the average of 45 sessions a month, it’s an extremely good deal.
User interviews are yet again the most popular method of user research, with 93% of PwDRs conducting at least one user interview a month. That’s pretty cool, since we named our company after them and all. The plurality of PwDRs, 30%, conduct 4-10 user interviews a month.
We also found that bigger dedicated research teams meant more user interviews. Since research teams are already strained for time and resources, it’s no surprise that small teams would hold less interview sessions a month and bigger teams would be able to devote more time to interviews. We looked at the plurality within each group to see how many user interviews teams of different sizes were conducting each month.
Even if your team is small, finding time for user interviews is important. Try setting up a continuous research practice to make the process less of a heavy lift. The process is pretty simple, here are the steps:
Moderated usability studies are the second most popular form of research. They’re especially important for research once you have a working prototype or even a wireframe. The plurality of PwDRs, 31%, ran 4-10 moderated usability sessions per month.
Unlike user interviews, which can help teams generate ideas and learn about their customers more broadly, usability tests do best when they have a specific purpose and hypothesis behind them.
For example, we recently launched the ability to edit screener surveys within User Interviews. Once we had built a prototype of what the solution would look like, we needed to test it. To do that, we needed to focus on specific questions and goals so we could properly structure the test.
The specific questions we needed to answer were:
This meant we were focusing on how researchers use the edit function and how they respond to the automatically copied save when editing a screener. We were not focusing on the overall effectiveness of the screener, the screener survey builder, or the project creation flow.
As far as unmoderated research goes, surveys were once again the most popular. Unmoderated research doesn’t require a researcher to guide the participant through the session, so it’s typically considered less of a heavy lift for researchers.
78% of PwDRs collect at least one survey reponse a month. Our question excluded screener surveys for larger research studies and focused on stand alone surveys. The plurality of PwDRs, 33%, collect 1-50 survey responses a month.
While surveys have their place, they aren’t our favorite research method, and we’re glad to see other methods increase in use. When we chatted with Erika Hall, author of Just Enough Research, about her stance on surveys, she was solidly against them.
“I'm a big believer in as many people as possible participating in design research but surveys are the one thing that I think really, really takes a lot of expertise in order to conduct and interpret correctly and usefully. But, the problem is, there are so many survey tools out there, they are so easy to create and run. The ease of running a survey is completely out of proportion to the expertise required to actually do it right that it's a really, really popular thing to do and all sorts of really important decisions are being made based on totally bad, flawed evidence.”
Surveys take a lot of expertise to run correctly, and overly relying on them because they’re easy, cheap, and available, isn’t the best way to learn about your customers. When crafted by trained researchers, they can be powerful tools.
Field studies climbed from 5th place to 4th this year. Last year, 55% of PwDRs did at least one field study a month. This year, however, 67% of PwDRs said they conducted at least one field study a month.
The plurality of PwDRs, 38%, were only conducting 1-3 field study sessions a month, which makes sense considering the time investment for each session.
We asked PwDRs who they were talking to get all those insights and found that many preferred to talk to users from their own audience, reporting lower percentages of outside participants. However, most people, 79%, said they recruited from both their own audience and outside participants, not completely from one audience or another.
Back to Table of Contents
PwDRs rely on a variety of different tools to make their work faster and easier. There are tools for taking notes, recruiting participants, keeping track of all your findings, conducting sessions, and everything in between. Since everyone’s always on the hunt for the best tools, we wanted to know what our PwDRs use to get their research done.
Recruiting participants is one of the biggest research headaches, no matter how long you’ve been doing UXR. Let’s dig into what PwDRs are using to make their participant recruiting faster and easier.
PwDRs got really creative when it came to recruiting from their own user base. 40% of them had solutions other than the ones we listed. They ranged from specialized internal tools to complicated strings of tools like a specialized email list linked with a screener test instead of a survey.
Of the tools we named, Calendly is #1, with 26% of people using it. The rest are close behind, with social media at 25%, SurveyMonkey at 23%, and User Interviews at 22%.
As a heads up, we, User Interviews, are the creators of this report and 21% of respondents came through our owned channels, so it’s certainly possible we’re overrepresented here.
When it comes to recruiting users outside of your existing user base, things get a little trickier. It’s harder to find people who are willing to chat with you, and if you go it alone, it takes more time than recruiting your existing users.
But talking to users outside of your base is incredibly useful. If you’re a new company, you can learn more about how you may achieve product/market fit. If you’re usability testing something new, fresh eyes can point out issues experienced users will breeze by. If you’re in a competitive landscape, testing with your competitor’s users can help you understand how you stack up.
25% of PwDRs used social media to recruit outside users. After that, 24% used User Interviews and 21% used UserTesting.
Last year, 52% of our respondents used User Interviews to recruit from outside their user base. A more even spread among tools is a sign that we’re hearing from more people outside of our customer base, and we’re happy to hear from a more diverse audience!
As with the tools for recruiting from your own user base, we didn’t see any significant differences in fulfillment, importance of research, or effectiveness of research in PwDRs who used the top three tools.
We saw that PwDRs using tools to help them recruit participants reported a higher number of average monthly sessions.
While recruiting participants from social media is often cheaper than using a dedicated tool to recruit participants for you, it can take more time and you can exhaust your potential audience quickly. Posting a call for participants every six months may yield great results on social media, but asking every few weeks can get old.
The right tool to conduct your research sessions depends on what kind of session you’re doing. Our PwDRs seemed to prefer video conferencing tools over others, with Zoom the clear winner.
Zoom took first prize last year as well, with 42% of respondents saying they used it. This year though, it seems to be dominating, as all other tools have fallen to almost half of its numbers. Of the unmoderated tools, UserTesting was the most popular, with 17% of people saying they used it.
When we looked into the best video conferencing tools for user research, we found that many researchers preferred Zoom for its stability, user-friendliness, and screen sharing capabilities. There are also many easy upgrades and extra features, like transcription and automatic session recording, that are useful to user researchers.
When it comes to note taking, there’s nothing better than a word processor. Whether you like Google Docs, Microsoft Word, or even Mac’s Notes app, word processors were one of our PwDRs favorite ways to take notes during a session, with 75% of PwDRs using them.
Word processors don’t get all the glory though. Tied for first place is video recording, with 75% of our PwDRs usage. Recording a video allows PwDRs to share clips of research sessions, go back and take a second look at their session, and share sessions with team members who couldn’t make it. They also make it easy to get transcriptions later.
49% of PwDRs used transcription tools to keep track of what happened in their session. Since transcription is usually an extra cost for each interview, it’s not surprising that less people are transcribing their sessions. However, last year only 38% of PwDRs said they used transcription, so it’s on the rise in our sample set.
This may be because of the rise of low-cost and AI-powered transcription tools that help researchers get a transcription of the session without blowing their budget. There are tons of tools on the market for transcription, and for UX research in general. Sometimes you need to spring for a real-live transcriber, but for just getting a good idea of what happened when, these AI-powered transcription services may work well for PwDRs.
PwDRs also had other ways they liked to take notes. Most popular was good old fashioned pen and paper, including sticky notes. People also used spreadsheets, Google Forms, and online whiteboards to keep their thoughts straight.
For organizing notes and feedback, there’s also a clear favorite, Excel and Google Sheets. 80% of our PwDRs said they use the powerful spreadsheet tool to make sense of their notes.
Coming in second, with 25% of the vote, were the PwDRs who used tools other than the ones we listed. We hear you! Next year, we’ll add even more tools to the list of options and take out the tools no one used. In fact, this year, Miro wasn’t on our list. Enough people wrote in to say they used it in the “other” comment box that we added it into our list. It placed sixth overall, overtaking a few of the tools we actually included as options.
Coming in third was Confluence, with 22%, then Airtable with 20%, then Trello with 16%. They beat out last year’s #3 and #4, productboard and Dovetail, respectively.
With all the different tools out there to organize notes, we wondered if researchers were sticking to just one tool or using a few to get the job done. It was almost split down the middle. 48% of PwDRs used just one tool to get the job done, while 52% used more than one tool.
For 86% of the PwDRs who used just one tool, that tool was Excel/Google Sheets. Our other top tools didn’t fare nearly as well, with no one else scoring over 5% of the total vote.
For researchers who used 2 or more tools to organize their notes, the other tools did much better. Excel/Google Sheets still held the lead for most popular, with 91% using it. But Confluence, Airtable, and Trello all scored well among people who used multiple tools.
When it comes to user research, getting the sessions completed is only half the battle. You’ll also need to catalog and share your findings with your team. To do this, some PwDRs use their own tailor made combination of spreadsheets and word processors, while others use specialized research repositories.
Overall, most people used presentation tools to share their findings. We chatted with Caitria O’Neill, Senior UX Researcher at Google, about what makes a good research presentation. She told us that great presentations are enjoyable, informative, and actionable.
To make her research reports enjoyable, Caitria uses themes and narrative storytelling structure to keep the audience engaged. Themes also make it easy to remember which presentation was which, especially when they’re a little out there, like “wolves in space.”
To keep them informative, Caitria focuses on what they learned and why it matters to everyone in the room.
She also uses her design skills to call out the most important information on each slide, making it easy for people to find what the information they’re looking for.
Lastly, she makes her reports actionable by summing everything up with a TL;DR and takeaway action items.
“This means you need to put in clear, near-term recommendations. That's sometimes hard for a researcher. We're supposed to be very objective, but that does not mean that you can't suggest the next steps in the process.
So, if the button was invisible, no one could find it, I don't have to tell them how to make it visible. I can give some suggestions if I'm feeling very confident, or if I did an audit. But, I do get to say things like, I'm going to test the next version of this and the button needs to be findable, or I can say things like, these are the top four things in order that make this design good or bad. It has to be a very clear recommendation and that push to make sure that people actually come back and act on it, even if they enjoyed the whole deck and your memes. It doesn't mean anything if they don't walk away with clear next steps to work with it.”
When we asked if researchers used sites like G2Crowd or Capterra to find new tools, the resounding answer was no. 80% said they didn’t use those types of websites to find new tools, so what are they using to learn about new tools?
We had an open-response text box to learn more about how researchers find new tools, and many said they just use word of mouth. PwDRs also said they learned about new tools from Slack communities, blogs, and just searching on Google. If you’re looking for new tools, you can check out our Tools Map and see if there’s anything that fits your needs. You can also check out Slack groups, blogs, and personalities our PwDRs follow in this interactive spreadsheet.
Back to Table of Contents
Research teams can take many different shapes and sizes, depending on how your company is structured, what your goals are, and how you do research.
Our PwDRs told us that research is most often a part of the design team (60%). This was followed by research as a part of the product team (45%), then research distributed across pods/groups/teams (40%).
We allowed our PwDRs to select more than one place research fit in their organization, and 84% of them told us that research is part of more than one team. User research is important no matter what team you work on. When we talked to Maggie Crowley, Director of Product Management at Drift, she walked us through how research is a part of the product management process, the design process, and the marketing process. Each team used and approached research differently, but united around a shared goal of understanding their customers more fully.
“To me, the more you can admit that you don't know the more powerful your ideas can be. Because when you understand what you don't know then you know what to research, then you know where to focus your metrics and your quantitative analysis and who to talk to. Then when you do come to a resolution or an insight you have all the backup research that will help your team understand why you made the call that you did.”
This year, we also asked who else may be in a session with researchers. 45% of PwDRs said that there were exactly 2 people in a session, and 39% said there were 3 or more people.
So who are all those extra people in the research sessions? We asked PwDRs how often they had moderators, note takers, observers, and AV/Logistics support in a session with them. 92% of people said they had an observer or a note taker with them at least some of the time.
Note takers were more of a staple, with 48% of PwDRs saying they always had one in a session with them. Observers were more occasional visitors, with 58% of PwDRs saying they sometimes had one in a session with them.
Acting as a note taker is a great way for people who are curious about research to get involved with the actual session. Many researchers like to invite designers, developers, and anyone else who may actually end up using the research in their work to participate as note-takers. It involves them in the nitty-gritty of the project without asking for too much. It also helps get people who may not normally interact with customers that face time they need to empathize with users and bring the focus back to them.
So how can you involve note takers in your research practice? Nicola Rushton has actionable tips, plus a template to make the process as simple as possible.
“My favorite way of [involving a note taker] is [to bring] the note taker on a laptop in the room with me. I have them on a Google Doc or a Confluence page or whatever it is. [I have] them typing verbatim as much as possible everything that the person says. I think some people sometimes balk at that if you've never tried to type for an hour of somebody speaking, it sounds like, "Geesh. That sounds pretty tough." But yeah, you'd really be surprised. It's totally possible. I've seen tons of different people do it, especially if you've given them a little bit of a template with some of the questions in it.”
Back to Table of Contents
Now that we know how research works at the team level, let’s zoom out a bit and look at the bigger picture—the companies.
When we asked our PwDRs if their companies did enough research, 80% felt their companies could be doing more.
You may never feel like you know your user enough, or that there’s nothing else to learn about your product. But we hope that more people move into the middle of this range where they feel like they are close to the right amount of research.
“User research is not only about understanding your users, but understanding how they think, act, and feel when it comes to engaging with the product or service you are offering. Companies have plenty of demographic data about their audience (age, gender, location), but user research can actually give you qualitative, behavioral insights about what your users do or how they use your product. In all these years working in UX, there has never been a single time when I did user research and learned nothing new. You simply cannot ‘know your users too much’”
Fabricio Teixeira, founder of UX Collective
Part of moving towards that “right amount of research range” could be implementing a continuous interviewing process. We talked to Teresa Torres, founder of Product Talk, about how she teaches teams to do continuous interviews.
“People often say, "I've talked to six customers. Is that enough?" I think the number of people you talk to is the wrong metric because for some things, you can talk to one person, and you get ... If you have a glaring usability problem, and the first person you interview helps identify that, well, you don't really need to talk to another person. You realize that, hey, we labeled this thing wrong. Other things are more complex, and you might need to talk to more people. But I think this metric of reducing the cycle time between customer touchpoints encourages the right behavior of: How do we just talk to customers as frequently as possible?
And then what does it look like? I really like to play with this idea of: What is a customer interview? We tend to think about it as, I need to have a three page discussion guide, and it's going to be an hour long, and it's this really formal research activity. But I actually think we can do five minute customer interviews. It just depends on what we're trying to learn, and that based on what you're trying to learn can dictate what's the length and volume of interviewing that you do.”
We asked our PwDRs if their organizations used research to make decisions. Most said their organizations used research well, though there’s always room for improvement.
While we’d love to see most people say they are very good about learning from research and taking action, realistically that’s a high bar. There will always be more research to do, more to learn, and more ways to improve. That’s part of what makes user research such an interesting field to work in.
“At the end of the day I feel like we're really just lucky to be in this field. It's fun, it's dynamic, you get to work with people and really learn all the time, every day. You just can't ever assume you know all the things because you just never do. That's just the human factor, it’s real. Learning from our customers and be able to serve them, it really is meaningful, so I love being in this industry.”
Susan Rice, Head of Product Design and Research at Toast.
Back to Table of Contents
As we’ve talked to more researchers throughout the year, we realized many don’t know or don’t have a set budget for research. So this year we added an “I don’t know” option to our budget question. It took 44% of the overall vote, making up the largest segment of our PwDRs.
If you’re a PwDR who wants a bigger or more defined budget for your user research practice, getting one can take effort. There are a few things you can do to show research’s value in your organization and drive home the idea that research is a necessary part of building new things.
“Proving the value of research doesn’t end when you get the approval for budget. In fact, that’s when it begins, and now you have to deliver! Find interesting and engaging ways to present your findings, share them with anyone who might be interested, and refer to them as often as possible in casual conversations, meetings, etc. (e.g according to our research…therefore…). Whatever you do, don’t let them forget your good work!”
Margie Mateo Villanueva, UX Researcher at Indeed
Of our PwDRs, only 15% didn’t create a report with their research findings. Most (65%) created a nuggetized or atomized findings report, which allows researchers to quickly organize their findings during research, leaving less heavy lifting at the end of a project.
Coded notes/transcripts, time coded videos, and the methods listed by our PwDRs in the “other” category, don’t need to take a lot of extra time to create but still give your stakeholders insight into the importance of your research.
We found that researchers who created a report rated the importance of research to their organization a bit higher than those who didn’t. Researchers who created any kind of report rated research’s importance to their org a 6.8/10, while researchers who didn’t create a report rated it a 6.2/10.
Tomer Sharon, who invented Polaris, the most popular version of the nuggetized report, with the WeWork research team, points out that traditional research reporting can be too dense and project-focused for stakeholders to easily refer back to.
“The atomic unit of a research insight is almost always long, fluffy reports and slide decks. If a VP asks, “What do we know about how our users in Germany decide to buy from us?”, there is not one easy way to answer the question. Reports are extremely centered on what was found in a study and are not granular enough to be used in the future. Many studies start with specific goals but end up finding additional important data. Reports fail to convey this data and make it accessible in the future. In addition, you will not be able to persuade me that there is one person on the face of this Earth that wakes up in the morning saying, “YES, I AM GOING TO READ A REPORT TODAY!” Not even one.”
Nuggetized reporting makes it easier for researchers to take note of their findings during research, and for stakeholders to make use of them later. But, at the end of the day, it’s all about whatever report will be most useful to your organization and stakeholders.
Creating the report is only half the battle, PwDRs also need to ensure stakeholders know how to access and read the report. When we asked PwDRs what percentage of their stakeholders knew how to access research findings on their own, only 12% said no stakeholders knew how to access research findings. What a relief!
When we talked to Vicki Tollemache, Director of User Experience Research at Grubhub, she pointed out the value of involving stakeholders and team members from many different parts of the organization in user research.
“From a financial perspective, I will say doing research at Grubhub has probably been the place that I feel like we have been the most supported. If the organization has a question, if they feel that the research is valuable, they will provide us the budget to do that research. They are very research-motivated, research-forward. In some regards, to be a researcher here has been the most freeing experience I've ever had.
Because they definitely have a lot of questions they want answered, and are very, very supportive in making sure that we answer those questions in a way that we think makes most sense. Educating your product partners and your design partners, and your dev partners and creating empathy, so they really understand the real world situation that our users exist, it means that they make better decisions and are more informed upfront. Which, I think my organization sees as an investment and as cost-savings in the long run.”
When more stakeholders know how to access research, research is more important to the organization. When most stakeholders know how to access research findings, researchers rated the importance of research to their organization an incredible 7.8/10, a full point above the average.
By ensuring stakeholders know how to access and understand research findings, PwDRs can make a better case for why research deserves a bigger budget. And if stakeholders know where to find research findings, they can use them more easily and see the value for themselves. It’s all a very meta cycle, and once you get it going, it’s easy for everyone to see the value of research.
Back to Table of Contents
Last year, we heard from all kinds of people who do user research at work. Product designers, developers, marketers, customer support, and of course, full blown user researchers. We learned that researchers can come in many different shapes and sizes, especially at companies with no dedicated user researchers, yet. We heard from people who worked in many different industries, showing research is one of those things that is useful no matter what you work on.
This year, we heard from more dedicated user researchers, and we’re excited to see that cohort grow since it likely comes with more resources and support for user research as a discipline. We also saw more of a spread in terms of average salaries, fulfillment at work, and years of experience. Plus, we added questions about what a typical work week looks like for PwDRs and how long they’ve been at their current jobs.
While there are lots of different jobs out there for people who want to research customers at work, most of the PwDRs in our survey were full blown User Researchers. Making up 68% of the total, they accounted for 10% more of the total respondents this year vs. last year.
We also heard from PwDRs who were product designers, marketers, customer support specialists, developers, product managers, designers, and people whose job titles didn’t fit any of those molds. All together, these folks accounted for 32% of our total respondents.
Most of the PwDRs we heard from, 78%, were individual contributors. This means only 22% were at the management level or above. This is a 10% decrease from last year, when 32% were at the management level or above.
When we asked PwDRs how many years of experience they had, we found that most (66%) had between 1-9 years of experience. User research is a growing profession, which is usually learned through hands-on work. It’s not taught in many schools. You can’t get an undergraduate degree in “user research” and there aren’t many courses that can teach you how to be a user researcher.
When we talked to three different UX researchers at Mailchimp about their journeys to UXR careers, all of them said they learned about user research as a career path after graduating. Jud Vaughn, Senior UX Researcher at Mailchimp, said his other professional experience gave him superpowers that allow him to contribute more to his team:
“My circuitous path gave me the superpowers that differentiate me from the rest of the team. I'd say the same for my teammates, as well. Without that, I wouldn't be able to do my job in the exact way that I do it. So, I wouldn’t change a thing.”
This year, we found that most PwDRs earned between $75k and $149k a year. This lines up well with Payscale’s industry data for user research careers. Their data has user researchers earning an average salary of $89,106 a year.
We can’t really talk about salary without talking about the years of experience that help PwDRs earn that salary. Our data showed that salaries increased with experience. While the plurality of people with 1-4 years of experience earned between $50,000 and $74,000 a year, those with 10-14 years of experience most commonly earned between $100,000 and $149,000 a year.
This lines up with data from Payscale, based on 919 responses from “user experience researchers.” While there are PwDRs in our data that earn more or less than the average range, there are tons of factors that can play into the salary you earn. Things like location, benefits, and type of company can all affect the salary you end up making. It’s important to know what your experience is worth and what the average salary is in your field and location.
User research can come with a unique schedule. There can be full days of user interviews, on-site field studies, or even in-lab research like eye tracking. We wanted to know if that part of the job affected how much time PwDRs spent at work each week. Luckily, we found that most PwDRs (59%) worked a normal 40 hour workweek. There weren't too many people working crazy hours either, with only 5% saying they worked more than 51 hours a week.
Most PwDRs (77%) have been at their current jobs for 2 years or less. Since user research itself is a newer field, this isn’t entirely surprising. Combined with the fact that people are staying at their jobs for less and less time, this seems like a result of working in a newly established industry in 2020.
The median amount of time salaried workers have been with their current employer in the U.S. is 4.2 years, according to the U.S. Bureau of Labor Statistics. For people aged 25-34, that median time dropped to 2.8 years. Why does this matter? Because our respondents were mostly aged 25-34 (59%).
According to a poll by Gallup, millennials (anyone born from 1980-1996) are much more willing to hop between jobs. 21% said they had changed jobs within the last year, which was more than three times the number of non-millennials who reported the same. 60% said they would be open to new job opportunities, should they come along.
The same Gallup poll stated that millennials put more importance on the purpose they felt at work than other generations, but only 37% were thriving in purpose at work. Gallup defines purpose as “liking what you do each day and being motivated at work.”
We measured fulfillment and how important PwDRs felt research was to their organizations, both of which were highest when people had been at their jobs for 5-7 years. We didn’t include data for people who had been at their jobs for 8+ years, since the sample was so small.
Again, how important research is to an organization greatly affects how PwDRs feel about the work they do. PwDRs who have been at their jobs the longest reported the highest importance rating, 7.8/10, a full point above the average.
“Only 26% of millennials say that in the past seven days, they have heard someone talk about how their daily work connects with their organization’s mission and purpose,” according to Gallup. This is a part of how they measure employee engagement across many companies, and track how it affects retention and productivity. According to Gallup’s State of the American Workplace report, organizations that rank in the top quartile for engagement experience 24% less turnover.
Understanding how your role fits into the bigger picture and feeling like your job matters is a huge part of how fulfilled you’ll feel at work. We saw a similar uptick in job fulfilment among people who had been at their current companies for 5-7 years. They rated their fulfillment a 7.8/10, also a full point above the average.
A part of why we see research’s importance and job fulfillment go up when PwDRs have been at their companies for 5-7 years could be that they have more established research programs. Those come with support, confidence in research’s ability, and value throughout the organization. You’re also more likely to stay in a job you find fulfilling.
Think user research is just for tech? Think again! We asked PwDRs what industry they worked in, and while most worked in tech-related industries, like Computer Software or IT, many worked in different fields. We heard from PwDRs who worked in industries like Education, Health/Wellness, Financial Services, and Health Care.
Most commonly, PwDRs rated their fulfillment at work as an 8/10. 2 points off perfect, not bad! On average, though, the fulfillment rating was 6.8/10.
So is 6.8/10 really that bad? If so, how can more researchers feel more fulfilled at work?
The answer’s a bit complicated. Last year, PwDRs rated their fulfillment a 5.1/7. We changed to a 10 point scale this year, to make it easier to compare fulfillment to other metrics, but that makes it harder to compare this year to last year. When you actually break it down, 5.1/7 is slightly higher than 6.8/10, but not by all that much (4 percentage points).
So it’s not that bad compared to last year’s data. How does it compare to overall fulfillment within the job market? According to a study by Imperative, only 33% of U.S. workers are fulfilled at work. They didn’t go into how they defined fulfilled, but 46% of our PwDRs rated their fulfillment an 8/10 or higher.
Why does job fulfillment matter anyway? According to a study by PWC, 7 out of 10 workers would consider an offer for a more fulfilling job, and 1 in 3 would take less pay if a job were more fulfilling. Fulfillment, to PWC, is a virtuous cycle, in which employees own their purpose and lean into it, utilizing resources and relationships at their current job.
Last year, our PwDRs biggest frustration at work was not having enough budget or resources to get the job done. This year, budget frustration fell to the #4 spot, and PwDRs were most frustrated with the structure of their organizations.
So what explains the huge surge in frustration for organizational structure? Probably hearing from more PwDRs who deal with more organizational structure. This year, we heard from 13% more people who worked at enterprise companies and 7% more who worked at companies with 10k+ employees. We also heard from PwDRs who worked in companies with larger dedicated research teams.
Leisa Reichelt, Head of Research and Insights at Atlassian, recently talked about her research experience in different organizations with Steve Portigal. When talking about her early career at an agency, she highlighted how research briefs for large organizations became mundane:
“I started getting to the point where I realized that in a lot of large organizations, if you stayed in one place long enough the same brief would come around over and over again. And that you could have a great time doing research and nobody would do a blind thing with it. And that stopped being fun when I realized that it was fun to do the research and then nobody would do anything with it.”
Back to Table of Contents
Ah, every stakeholder’s burning question. Considering fixing a problem post-development is 100x more expensive than fixing it beforehand; we’d say knowing what problems you may encounter is pretty darn important.
On average, our PwDRs rated their research’s effectiveness 6.8/10. There are a few factors we found that made researchers rate their work’s effectiveness higher.
When we asked researchers how fulfilled they were at work, the average rating was 6.8/10. We found that PwDRs who rated their fulfillment higher than the average (from 7-10) also rated their effectiveness higher, at a 7.3/10. People who said their fulfillment was below average (from 0-6) also rated their effectiveness below average, at 6/10.
If you’re feeling unfulfilled or ineffective at work, it will affect your ability to do your job well. Recently, we chatted with Vivianne Castillo about the importance of self care for PwDRs. She talked to us about how sometimes, when researchers are feeling burned out or unfulfilled at work, it’s because they’re not taking the time to care for themselves in the ways they need to. It’s difficult for PwDRs, and for everyone, to step back and see what may be keeping you from doing your best work.
“I think a part of it is knowing when good is good enough. I think sometimes, especially for us, we often feel like we have to carry this mantle of being the advocate and the champion. And I think sometimes we have to be able to step back and recognize there's only so much you might be able to communicate to a certain stakeholder, whether it's on that particular project or even within the scope of our time being at that company. And I think that's a hard thing to accept, because then in some ways it almost feels like you're giving up. It feels like, "Oh, maybe I'm not doing my job correctly." But I think what that does is it gives you permission to do a couple things.
It gives you permission to emotionally not be so invested. I think it gives you permission to try new ways of engaging that person or new angles of approaching that person that maybe don't seem as taxing as other proposed ways that we often talk about within the community. And I think it also gives you the language to understand what's happening within you and how to communicate that to your manager, if you are having difficulty or you need their support or advice dealing with a particular stakeholder. And I think that is something that ends up benefiting you as a professional in how you advance in your career. And so those are the first things that come to mind.”
If you’re feeling burned out or unfulfilled, consider taking time to care for yourself and evaluate what may be making you feel that way. Vivianne has a great worksheet to help you take inventory of your current job. It encourages PwDRs to look at things like their schedules, support at work, and how work is affecting their personal life. Taking the time to evaluate these things and work towards changing some of them can help you feel more fulfilled at your current job, or decide it’s time to move into a new one.
As PwDRs move forward in their careers, they are more confident about their work’s effectiveness. Newbies, who had less than a year of experience, rated their effectiveness at 5.3/10. Meanwhile, those with 15-20 years of experience rated their effectiveness highest, at 7.2/10. Overall, people with 5+ years of experience rated their effectiveness above the average, at 7.1/10.
This makes sense, considering UXR is a multidisciplinary, pretty hands-on field. Much of what you know, you learn on the job, rather than in a classroom. NNg puts it like this:
“In the user experience field, skill is strongly dependent on experience. For example, university courses don't teach the details of how to correctly run a usability study. As a result, entry-level staffers typically need extensive mentoring before they can do a good job in practical projects.
Experience also dramatically increases a person's ability to infer underlying design flaws from observing user behavior. User behavior is remarkably consistent over the years. The more users you've seen, the more accurate your judgments and predictions of future user behavior.”
It also makes sense that people with more hands-on experience don’t continue to improve their effectiveness ratings at the same rate throughout their career. This is due to the power law of practice, aka the learning curve.
Say you’re just starting out and you’ve only spent, let’s say, 50 hours conducting user research. That next 50 hours will literally double your time spent doing research, and increase your skill greatly. For someone who has been in the field for years, and has spent closer to 1,000 hours talking to users, that next 50 hours isn’t quite as impactful.
If we can conjecture further, user researchers are a humble bunch, likely to constantly see room for improvement. Only 6% gave themselves a 10/10.
More people, more power! The average effectiveness rating increased as the number of dedicated researchers did, topping out at 7.2/10 for teams of 21+. This makes sense, considering organizations that have the power to have research teams of 21 or more people are likely doing a lot more research.
We saw a similar increase in effectiveness in teams that had more people doing research (as opposed to more dedicated researchers in the section above). Nicola Rushton, a design consultant who has worked with companies like Atlassian, Telstra, and Lexicon, recommends involving your team as much as possible in the user research process.
“I think a lot about this phrase that comes up in the world of teaching, which is, ‘Tell me and I forget, involve me and I understand.’ I think if we think about times that we've learned things in a teaching environment, it's often the moment that the teacher really gets you to come to the answer yourself. Those are the moments where it really sticks. I'm looking at those moments and wondering how I can bring that into my research practice, to the people around me, to get them to really get it.”
Involving the team in your research practice in a thoughtful and considered way allows people to learn more about research, get more hands-on experience, and ultimately become better researchers themselves.
PwDR’s effectiveness shot up to 7.3/10 when research was considered a central resource to the company. When research is a shared resource, it can give more people the ability to learn about customers and validate their ideas with real research data.
When research is isolated to just one team, access to research can also be isolated. Ashley Tudor, who has worked in user research for over 10 years at places like IDEO, stresses the importance of keeping research top of mind and accessible to everyone at your company.
“Keep research top of mind. I connect with PMs and designers on a monthly basis and discuss specific topics they are working on, even if I don’t have the bandwidth to run their project. Together we discuss questions, research methods, explore what they can expect, how these learnings could be actionable, and project timing. As a result, the types of questions we ask of research get better. Working together helps stakeholders develop a sense of different approaches and the problems they are best suited for. PMs and designers also develop a sense of when data will best support their decisions, so together we can proactively plan. The result is a pipeline of actionable projects. Through this process, we learn to support each other to do our best work.”
We’ve seen embedded and centralized models and hybrids all work well for teams. The key in an embedded model is to make sure researchers are learning from each other across units, and that everyone who could does benefit from that research. For centralized teams, the key is great organization so research can happen fast and with the appropriate amount of rigor, avoiding overly bureaucratic processes that can happen at scale.
It seems obvious that how important PwDRs feel research is to their organization affects how they see their effectiveness. Say that five times fast.
PwDRs who thought research was very important to their organization, rating it an 8/10 or higher, also felt their work was most effective, giving themselves an average effectiveness score of 8/10. On the other hand, people who felt research was not very important to their organization, rating it a 4/10 or lower, felt they were not very effective, giving themselves an average score of 5/10 on effectiveness.
Feeling like the work you do is not important to your organization is really disheartening. In fact, it's one of our PwDRs biggest frustrations. 20% of PwDRs said buy in of importance at research at the top was their biggest frustration at work, making it #2 behind organizational structure/bureaucracy.
So what can PwDRs do to ensure research is important to their organization? Talk to stakeholders and communicate value in terms of impact.
Stakeholder involvement is key to a successful user research practice. Stakeholders are the company leaders who make budget decisions, the developers and designers who take research insights and build the solutions, and the management teams that need research to choose the right strategy.
“To me, the biggest predictor of success on a study or in a client relationship is how involved the stakeholders are. And if the stakeholders are involved from the onset, and they may not be believers to begin with, but if I can convert them, and if I have my stakeholders that are active, engaged, I'm 90% sure that I'm going to be able to move from insights into action and get that team to act and address the learnings along the way.”
Michele Ronsen, Founder of Ronsen Consulting
At the beginning of any research project, take the time for stakeholder interviews. Zach Lamm, Senior UX Researcher at SoFi, recommends asking stakeholders three questions during these interviews.
These questions help PwDRs learn more about what expectations stakeholders have for research, how research affects them, and how research impacts the organization as a whole.
When we asked PwDRs what percentage of stakeholders knew how to access research findings, we found the majority thought only 1-40% of stakeholders did. We looked at this cross referenced with how important researchers felt research was to their organization. We found that the more stakeholders PwDRs thought could access research, the more important they felt it was to their organization.
No one will buy into research if they can’t see how it helps them achieve their goals. Jared Spool, co-founder of Center Centre, said this about how UXers need to communicate value:
“Here’s a hard truth user experience design leaders find themselves learning: No one will buy into your UX design ideas if they can’t see how those ideas matter to them.
This is especially true for your organization’s leadership. They need to see how all those great UX design ideas will push forward their top priority, helping the organization. If they can’t see it, they won’t get behind your great ideas.
Within an organization, a design leader can only do so much on their own. At some point, getting executive buy-in becomes a necessity. Design leaders will then need to win over their executives by showing them how their UX design ideas make the organization stronger.”
So how can you communicate your work’s value effectively? Think of it in terms of impact. What priorities does your organization have right now? How does your work move those forward? How much of the budget does your work need vs. how much value does it give back to your team? Putting your work in these terms can not only make it easier to get stakeholder buy in, but to prioritize what you need to spend time on.
Now that you know all about where user research sits today, how can you stay up to date until the next State of User Research Report? 😜
We asked PwDRs how they stayed up to date with all the latest in user research, and is it a lot of resources! PwDR’s favorite way to stay up to date was the written word, with 75% reading Medium articles. Closely behind was Slack communities, with 73% saying they kept up with the research world there.
It’s worth noting that we received 47% of our responses through Slack communities, so our pool may have been a little biased towards those.
Overall, PwDRs consumed a huge variety of media to stay up to date with UXR. They go to physical events, like meetups and conferences, chat in online communities, cozy up with good books, stay current with newsletters, and tune in to podcasts.
The PwDRs who responded to our survey were exceptionally helpful in providing specifics on where they were keeping up with UXR. We added all the resources they mentioned into an Airtable, and added a few more we thought might be useful. Everything’s color coded, and we’d love to continue adding to this list! If you’d like to contribute a tool you love using, add it here.
Back to Table of Contents
We’re so excited about how user research has evolved even since our last report. Since it’s 2020, a time for looking ahead into what the new decade could hold, let’s take a moment and think about what’s ahead.
We were a little disappointed to see testing for accessibility ranking dead last in terms of its importance to research programs. Testing for accessibility is an important part of developing products your customers can use.
Microsoft’s inclusive design toolkit does a great job of illustrating how important it is to design for everyone, and how designing for people with different abilities can help everyone. They state:
“By designing for someone with a permanent disability, someone with a situational limitation can also benefit. For example, a device designed for a person who has one arm could be used just as effectively by a person with a temporary wrist injury or a new parent holding an infant. Being mindful of the continuum from permanent disabilities to situational impairments helps us rethink how our designs can scale to more people in new ways. In the United States, 26,000 people a year suffer from loss of upper extremities. But when we include people with temporary and situational impairments, the number is greater than 20M.”
Being mindful of disabilities, and doing user research to ensure your products are accessible, benefits more people than you may think.
Designing for accessibility is also becoming a legal imperative. Last year, a case was brought against Domino’s because it’s website is inaccessible to the blind. Creating things that are accessible to everyone, regardless of ability, is becoming a larger conversation. We hope to see it’s importance grow for research teams as well.
Back to Table of Contents
It’s been a great year for user research. We heard from more dedicated researchers, working on bigger teams at bigger companies. We learned that most PwDRs are doing research before anyone designs anything. PwDRs are doing ~45 research sessions each month, and prioritizing understanding their customer’s needs in the process. PwDRs feel their work is more effective when they are more fulfilled, have more experience, work on bigger research teams, and feel research is more important to the organization they work in.
Overall, the future of user research looks pretty bright. We’re looking forward to continuing to learn from this community of curious and super-smart people! Until next year 👋.
Former Content Writer at UI
Carrie Boyd is a UXR content wiz, formerly at User Interviews. She loves writing, traveling, and learning new things. You can typically find her hunched over her computer with a cup of coffee the size of her face.