Growing up in a tiny farming community town in Iowa, Brandie Smith never imagined she’d get a job in tech — let alone a position at one of the world’s most famous companies. But in 2017, she was headhunted by a former colleague to join Facebook as a User Experience Researcher.
“I’d been a program evaluator and an educational researcher, but Facebook gave me my introduction to user research. I immediately realized this was exactly the type of research I wanted to do. Impact, influence, and without the need to wait for a year or two before seeing results,” Brandie said.
She worked at Facebook for about a year before joining the pay-per-mile car insurance company, Metromile, as Senior User Researcher.

“I was thrown into the deep end at Facebook, but it was incredible to work at this huge company with the world’s best researchers. The group was diverse, with researchers from all sorts of backgrounds. I learned so much from this pool of experts and the experience was so valuable when I joined Metromile,” she said.
When she accepted her position at Metromile, she did so because it offered a unique challenge that not all companies had to offer: the ability to push herself to answer complex questions by learning and conducting new methodologies as the company’s first and only user researcher.
While Metromile didn’t have a formal user research program in gear before Brandie arrived, the designers were already doing a lot of their own investigations on an ad-hoc basis. User research was valued and supported, but it was Brandie’s responsibility to own the process, guide the strategy, and provide more structure.
In this interview, we’ll learn Brandie’s most interesting and unusual user research techniques, from love letters/breakup letters to using memorable moments for retrospective experience maps. We will also hear about unexpected findings and how she tweaks common tactics in new ways.
Note: Looking for a specific audience to participate in your UX research? User Interviews offers a complete platform for finding and managing participants. Tell us who you want, and we’ll get them on
Love Letters & Breakup Letters: Learning How Your Customers Really Feel
The beauty of human-centered user research is that you aim to get to the heart of what people feel. Brandie borrowed an idea about how to do this with user interviews by asking research participants who were not Metromile customers to submit something a bit unusual: a love letter or a breakup letter... addressed to their car insurance company.
Metromile offers low-mileage drivers a chance to pay car insurance premiums tied to how many miles they drive. The pay-per-mile model can result in significant savings if you primarily take public transportation, only drive on weekends, or only use your car for a few errands, for example. Founded in 2011, it’s a relative newcomer to the car insurance world that attracts many drivers who are dissatisfied with traditional insurers. Powered by AI and consumer-centric design, Metromile aims to offer auto insurance that’s personalized, fair, and affordable.
“Initially, the project was designed as a competitive analysis exercise for Metromile to understand what other insurance companies were getting right or wrong for consumers,” Brandie said.
But it also had plenty of unforeseen benefits.
“This research really got at the emotional impact that insurance companies have on consumers. If you asked directly whether people liked their provider, they’d say ‘Yeah, fine, don’t really think about it much…’ But this method [of using letters] brought a richer core understanding of the customer experience,” she explained.
Some of the breakup letters talked about being stabbed in the back; others labelled their insurance company as an unavoidable irritation. One person wrote that they were proud to have been complimented on their safe driving, only to be suddenly betrayed by rising rates. Others claimed to have been misled, making them ready to end their toxic relationship.
In contrast, the love letters talked about feeling safe, secure, and confident. Some called their insurance company a strong and loyal friend who watches over them and has them covered, no matter what.
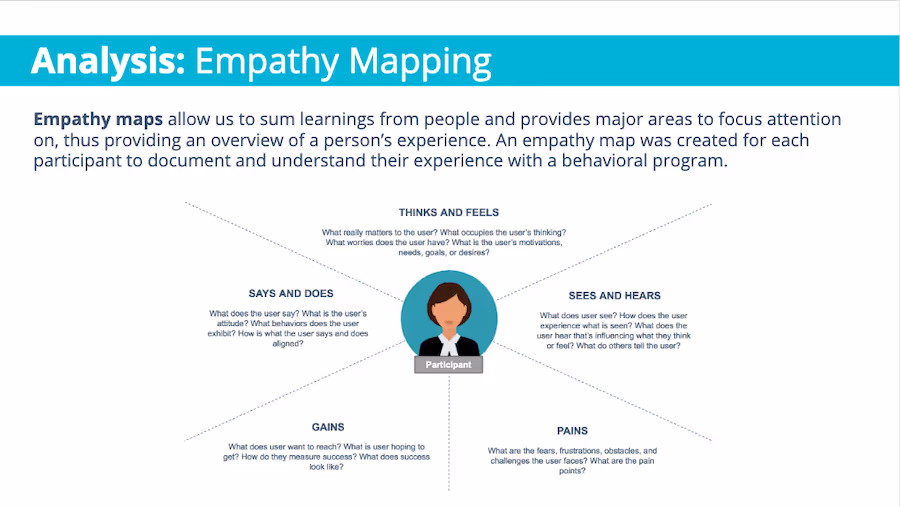
“This process helped us build better empathy maps for each user. Empathy maps provide an overview of a person’s holistic experience — what occupies their minds, what their motivations and desires are, what worries they have, etc. They also tap into behaviors and attitudes. So I tied these maps into each person’s letter to create an even richer record.”
Brandie sent completion instructions and examples of letters to prompt her recruits, but these examples weren’t related to insurance. This guided people to write thorough responses, without encouraging bias or giving them something to copy. Participants submitted their letter a day prior to their interview, allowing Brandie to structure her discussion guide questions around the themes that emerged in the text.

To find participants, Brandie set up a screener survey on the User Interviews platform. To make sure that recruits couldn’t guess what she was looking for, she hid qualifying criteria in a list amongst questions about different types of insurances and product types.
“I was afraid that we wouldn’t find enough people in our criteria, but I was blown away that within 24 hours we had more people than we needed. I had that experience again recently and I’m always surprised,” she laughed.

“The letters were amazing,” Brandie said. “We shared them across the company. They were not only entertaining but also extremely insightful.” Those insights helped her team understand, in a concrete way, what they should and shouldn’t do as a growing car insurance company and why.
As with any user research project, communicating the results to the product team was one of the most important moments for Brandie. Luckily, it was a collaborative project which included a cross-functional group of stakeholders who were all interested in sharing the results. When the results were in, Brandie made sure they made an impact.
“I did an affinity mapping exercise together as a group, in which I wrote everything down from the empathy maps on post-its. Seeing dozens of post-its with similar sentiments is much more powerful than showing stakeholders a deck, because they could physically see the volume of insights and the patterns of responses from participants,” she recounted.
Experience Journey Maps: Identifying Key Points in Service Experience
Brandie learned a lot from her time at Facebook, and when Metromile wanted to investigate people’s experience with the insurance claims process, she leveraged a cool idea that was also promoted on Medium by one of her former colleagues: retrospective experience mapping.
“I like to do a mix of talking to our own customers and talking to customers of other insurance companies, just to see where our experience is excelling or not excelling in comparison. Also, just because they’re not a customer now doesn’t mean they wouldn’t be. We’re not only designing for our current customers; we need to be thinking about those who may join us,” she said.
Brandie again used User Interviews (Recruit & Research Hub) to get this mix of people and screened them on whether they’d filed a claim for an accident in the past three months. Again, she was able to hide this qualifying criteria in amongst other questions, so as not to give the game away. She was also looking for a particular outcome from a claim: whether the person chose to repair their car or not.
“Once I gathered the recruits, I got them to create an Experience Journey Map, featuring the memorable moments of their claim experience on the X axis. On the Y axis, they mapped how they felt about those moments, on a scale from very negative to very positive,” she said.
Next, the participants connected the dots to each other, providing a holistic view of the experience journey throughout the claims process...
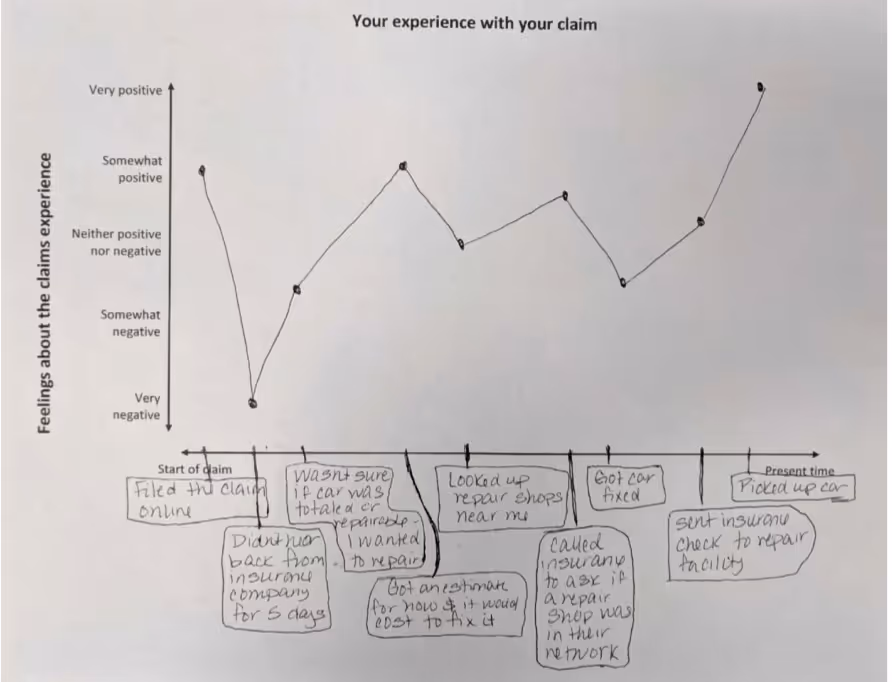
“In truth, the maps were all over the place,” Brandie said. “But this reminded us that each person has different expectations and experiences. They gave us a really good visual insight into what was painful, how and why people become satisfied, and which aspects of the claims process people remember.”
A fortunate side-effect was that “giving homework” made Brandie’s follow-up interviews much easier, something that has been true for many of her research projects. The maps took around 15 minutes to complete, but the process reminded participants more acutely about their experience. This meant they were able to recall more information and reflect more deeply during the 1:1 interview.
“It was undoubtedly fresher in their mind than if I’d asked them out of the blue,” Brandie says.
This research has resulted in useful artefacts for the whole team to see, including a visual diagram showing how the Metromile claims experience compares to others. As her research progresses, Brandie aims to highlight clear trends to give a picture of where to focus when improving the claims process.
Tweaks on Common User Research Methods
While Brandie loves to try out new ideas, she doesn’t hesitate to use trusted user research methods when the team needs basic guidance on the path forward. She tends to do a lot of low-fidelity prototype and concept testing in collaboration with designers and product teams.
“We often put together multiple prototypes and use the RITE method (Rapid Iterative Testing and Evaluation). The spin is that you never test the prototype with the same people. Test it with one small group — perhaps two people. Take the learnings, adjust the prototype, and bring in another group. This prevents you from hearing the same feedback over and over, and means you remove the biggest blocker before the next group, who can then draw your attention to a deeper blocker,” she explained.
In addition, she has another favorite test for when a prototype could move in several different directions and her team wants to know which way to go.
“Each prototype will have its own spin on a particular concept. For example, the first one might have a progress bar, the second might have a chart, and the third might have some text,” she said. “I ask participants to place an ‘X’ nearest to the one they’d want to see if they opened up the live product. Sometimes there’s a clear winner, sometimes the mark goes between two options, and sometimes it goes right in the middle of the triangle.”

According to Brandie, once you force people to make a choice, the trends become obvious. After overlaying multiple responses from a study, she can see the patterns in what people desire — or expect — from a product. And of course, this is followed up with a question to understand more about the why. Although sometimes, the ‘why’ reveals itself during the exercise.
“When forced to choose, participants make and verbalize the tradeoffs between concepts and how their final choice meets a need of theirs that may not have come up previously in the interview,” Brandie said.
Not sure which research method is best? Our UXR Method Selection Tool can help.
What to Do with Unexpected Findings
Brandie keeps her eyes and ears open in every research project in case there are unexpected findings hidden in a separate project. But just because you find something unusual doesn’t mean you should rush to implement a change. Here’s an example of what she found during a standard study and how she followed up on that insight.
“We were thinking about adding an element to the end of the Metromile quote flow,” she began. “I needed people to go through the whole flow process to get a basic understanding of how pay-per-mile works (in order for them to think about the next thing they saw if they were signing up). This was basic background, because showing them the prototype in isolation without the context of what they would have seen beforehand would make no sense.”
“The intention was to check their interactions quickly and move onto the purpose of the research,” she continued. “But by the third or fourth person, I saw a worrying trend: some people weren’t understanding the pay-per-mile model to the extent we expected. There was clearly confusion about how it works. Internally, we felt we’d done a good job to make it simple enough, but this unexpected finding suggested otherwise.”
But Brandie believes in considering quantitative and qualitative research together before taking action. She knew she’d only looked at a small sample size; while the insights were illuminating, she needed to dig deeper. Adding a question at the end of a survey Metromile administers to collect continuous feedback on users' quote experience allowed Brandie to get a quantitative measure from hundreds of people, and the results showed that the problem wasn’t as huge as she’d anticipated.
“It was still valuable to hear the qualitative feedback about understanding pay-per-mile, but the numbers showed that we didn’t actually need to drastically change direction or abandon ship,” she says.
Balancing the New with the Old
It’s clear that Brandie loves trying new methods and incorporating fun twists on old tricks. But she pairs that love of innovation with a dash of caution, as illustrated in the previous example. By combining fun, unusual research methods with the tried & true, and by balancing qualitative and quantitative research, she’s able to provide her team with valuable insights… and have fun doing it.
Note: Looking for a specific audience to participate in your UX research? User Interviews offers a complete platform for finding and managing participants. Tell us who you want, and we’ll get them on your calendar. Sign up for free. You’ll only be charged for people who actually take part in your study.