The fourth annual State of User Research report has more insights, more data, and more design cred than ever before.
This report unpacks the findings from our State of User Research survey, which we’ve conducted each year since 2019 in order to uncover trends in:
- user research (the art, the science)
- User Research (the fast-growing field)
- user researchers (the intrepid, curious humans who do user research)
Like so much of what we do at User Interviews, this report was a heroic team effort. In addition to myself, much credit is owed to Roberta Dombrowski (VP, User Research), Lily Hanes (Research Operations Manager), and Holly Holden (Visual Designer).
And this project could not have happened without considerable help and input from Erin May (VP, Marketing & Growth), Lizzy Burnam (Content Marketing Manager), and JP Allen (Senior Growth Marketing Manager). Rockstars, every one of them.
🍋 Ready to dive into this year's data? Head to the State of User Research 2025 to explore the full report and download the dataset.
Explore the data
We went the extra mile this year and have made the data available in three formats. You can explore the State of User Research 2022 as a:
- Slick interactive webpage
- Full-length (86-page) PDF report
- Spreadsheet with the full survey dataset (anonymized, of course)
🍋 Head to State of User Research 2022 to dive in and download the full report + dataset.
Just want the highlights? We’ve pulled out some of the big takeaways below.
Note: In the report, and in this article, we use the term “researchers” to mean everyone who regularly does user research; UXRs refers specifically to people with UX/user research titles (or equivalent); PwDRs, people who do research, refers to people who spend at least 10% of their job on user research but who aren’t UXRs in name.
Companies are (more) bought into UXR
Common researcher frustrations

It’s amazing how quickly things can change. When we conducted our first State of User Research survey in 2019, 1 in 5 of the researchers we surveyed said that buy-in about the importance of research was their biggest frustration. In 2020, the results were the same—buy-in was the biggest pain point for 20% of researchers. Last year, 14% of people said the same.
In this year’s survey, we asked the question a little bit differently—we asked folks to rate their experience with certain job factors on a scale from 1 (very dissatisfied) to 5 (very satisfied). Only 3% of researchers said they were very dissatisfied with the degree of buy-in at their organization (i.e. it was one of their biggest frustrations).
That’s a huge shift in just a few years!
Researcher sentiment isn’t the only place we can see evidence of more buy-in; data on everything from UXR salaries to growing team sizes to investment in Research Operations make it clear that User Research is becoming a need-to-have in companies of all sizes.
📊 Need to demonstrate the value of UXR to your stakeholders? This article breaks down the 4 most common objections to doing research using cold, hard, stats. These will help you show your team that research is worth the time, budget, and effort—even in an uncertain economic climate.
Most early-career UXRs earn $100-$150k
A plurality (43%) of UXRs in the United States make between $100 - $150k; another 34% earn over $150,000 (up from 12% in 2020).
Average UX Researcher salaries, naturally, increase with experience. But most UXRs are now starting from a pretty comfy place to begin with; according to Glassdoor, the average salary for an entry-level researcher with less than 1 year of experience is $91,259 (up 21% from $75,259 in 2020.
With just a few more years under their belts, US researchers can expect to earn anywhere from 10% to 65% more than their starting salary. Over half (52%) of early-career UXRs in our survey (people with under 5 years of research experience) report earning $100 - $150k—up from 24% who reported salaries in the same range in 2020.
UXR salaries, by years of experience (US data)

For perspective, the median household income in the United States in 2020 (the last year for which census data is available) was $67,521.
That means an entry-level User Researcher stands to earn 35% more than the national median household income. And the majority of our own UXRs (the 67% who earn between $100,000 and $200,000) are paid 1.5 to 3X the median US household income.
Note: Because of the way our audience is distributed (over half (53%) of the people we surveyed live in the United States, with the other 47% scattered across over 50 countries from Canada to Brazil to Kenya) we focused our salary analysis on data from US researchers.
But we’ve heard you on social media—keep an eye out for an update to our User Research Salary Report later in the year, in which we’ll explore salaries in other countries as well.
See the latest 2026 UX Salary Report!
Research is distributed
Most researchers in our survey don’t work in a Research department; in fact, only 17% said their company had a dedicated User Research department. Unsurprisingly, people who work in very large organizations (over 10k employees) were more likely to have a separate department dedicated to research (42%).
It’s more typical for researchers to be embedded in non-research teams like Design and Product. In fact, both dedicated researchers and PwDRs tend to be distributed across multiple departments. This is true even in very small organizations, and researchers only become more distributed as companies scale—even as the occurrence of dedicated Research departments becomes more common.
That’s because the majority (57%) of survey participants, and 66% of folks in very large organizations, said that while researchers are embedded within a team, they also work together on cross-functional projects.
How is the research practice situated in different orgs?

This pattern is what we’d expect to see in companies where user research has been democratized across the organization.
PwDRs do more evaluative research
So, what does that mean for the user research itself? With both UXRs and PwDRs doing user research, how do companies decide who works on what?
We didn’t ask about this explicitly in our survey (i.e. there was no question about “How are user research projects and responsibilities divvied up between UXRs and PwDRs at your company?”).
But we did ask researchers to tell us about the methods they use, and how often they use them on a scale from 1 (“I never use this method”) to 5 (“I use this method in almost every study”).
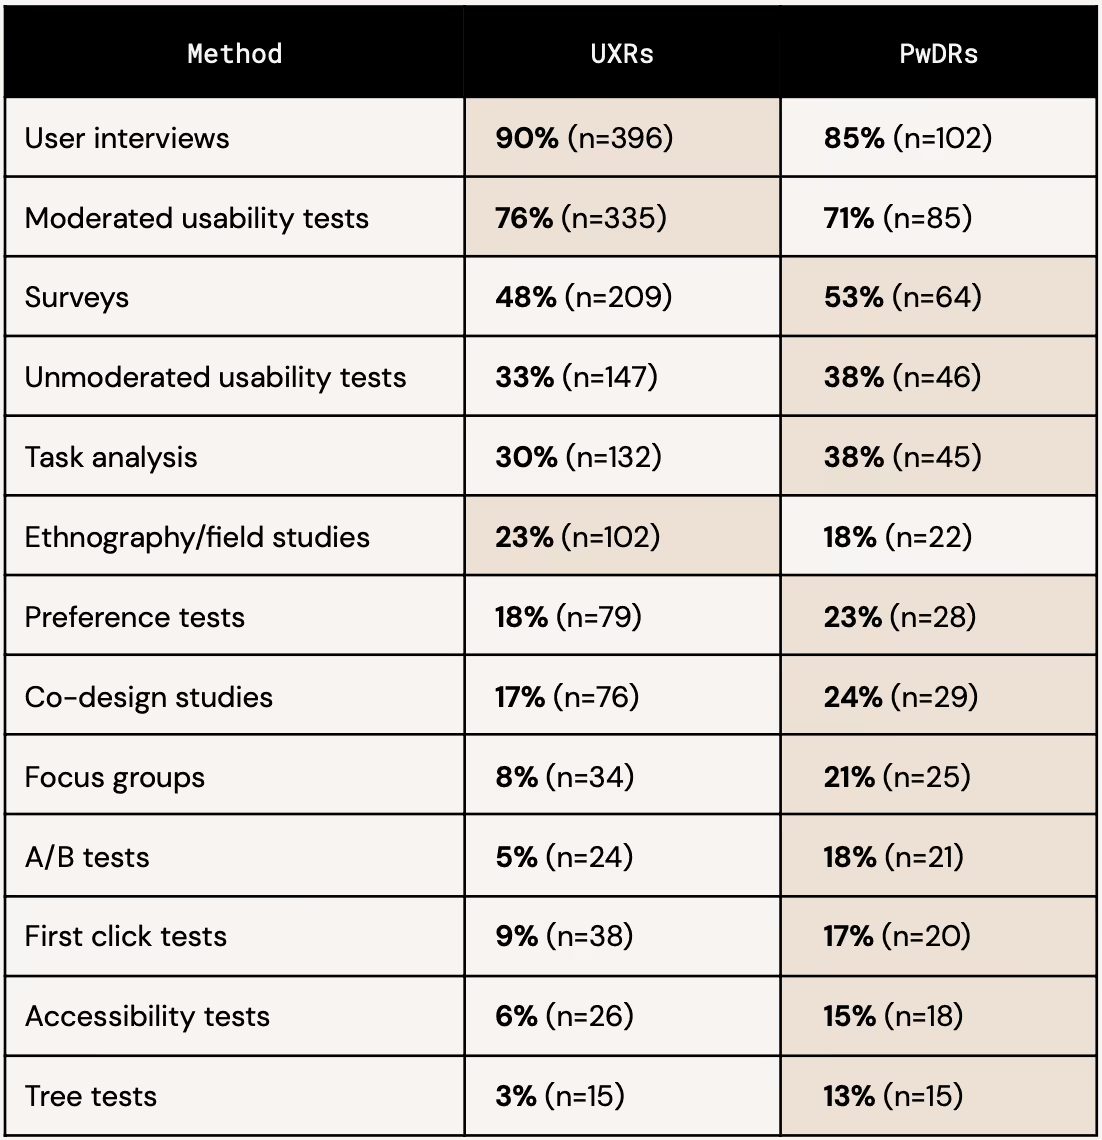
By analyzing the responses from UXRs and PwDRs, it’s clear that in many organizations, dedicated UX Researchers are owning generative, discovery research while PwDRs tend to conduct more evaluative research (like first click tests).
Both groups ranked the following 5 methods as their most frequently used:
- User interviews
- Moderated usability studies
- Surveys
- Unmoderated usability studies
- Task analysis
But PwDRs are more likely than UXRs to say they frequently use evaluative methods like:
- A/B tests (18% vs 6%)
- Accessibility tests (15% vs 6%)
- First click tests (17% vs 9%)
- Preference tests (23% vs 18%)
- Tree tests (13% vs 3%)
Given that a majority (67%) of the PwDRs we heard from are Product/UX Designers, it makes sense that they would lean toward methods that are commonly used during the design and testing phases of product development.
User research methods used by UXRs vs PwDRs
Not sure which research method is best? Our UXR Methods Selection Tool can help.
Research Ops is on the rise
This was the first year we’ve outright asked about Research Operations in our survey. That’s partly because, back when buy-in about user research was a top frustration and researcher head counts were lower overall, Research Ops was still an emerging discipline.
But that’s quickly changing. As research practices mature and teams grow, more and more companies are realizing that they need someone (or someones) owning operations full-time.
Research Operations is the discipline of organizing and optimizing people, processes, tools, and strategies to create repeatable systems that support research at scale and amplify its impact across an organization.
At the project level, research operations tasks include things like scheduling sessions, distributing incentives, maintaining a research repository, etc. In the absence of a dedicated Research Operations team, this work tends to be decentralized and is handled by researchers themselves. The majority of researchers (61%) in our survey said this was the case at their company.
Who is responsible for research operations tasks?

But we were excited to discover that a fifth (22%) of the researchers in our survey said they were supported by a Research Operations Manager; and nearly half (47%) of people on teams with 12 or more UXRs said the same.
Occurrence of Research Operations, by team size

Smaller teams tend to make do without—in interviews, we’ve found that some PwDRs are absorbing research operations as a key component of their role at small and medium-sized companies. And in our survey, 15% said that at their company, the work of research ops is owned by a limited number of (non-Research Operations) people.
We predict that some of those folks will eventually move into a full-time Research Operations role.
And companies would be smart to open up opportunities for that kind of transition: Researchers working at companies with a dedicated Research Operations Manager (or equivalent) were more fulfilled at work and reported higher satisfaction with everything from their tool stacks and research budgets to their career paths.
Only 1/10 of the top UXR tools are actually designed for UXR use cases
Speaking of tools… Most of the tools used for UX research aren’t designed for that purpose at all.
When you think about it, that’s not hugely surprising. After all, most researchers work at companies full of people who don’t research at all. Tools like Google/Microsoft office suites, Figma, Slack, Zoom, Confluence, and Miro make up the cornerstones of most UX research tool kits—all of these are flexible, collaborative platforms that are widely adopted throughout a company.
Generalist tools used for research

Researchers use these multipurpose tools for everything from planning studies to conducting sessions to analyzing and storing insights.
In fact, when we looked at the top tools (by percentage of researchers who said they used them as part of their work), there was only one tool on the list that was specifically designed for UXR. Can you guess which one?
- Figma/Figjam (79%) 79.03%
- Google Docs/Sheets/etc. (75%)
- Slack (70%)
- Zoom (70%)
- Miro (65%)
- Calendar tool: Google calendar/Outlook (63%)
- Microsoft Word/Excel/etc. (55%)
- Calendly (47%)
- User Interviews (44%)
- Confluence (44%)
Yep! User Interviews was the only one of the 10 most frequently used tools made specifically for user research.*
Researchers use UX research tools, too, of course. But the adoption rate of any one solution is lower; teams are layering in tools like User Testing (34%), Optimal Workshop (31%), Dovetail (21%), Lookback (19%), UserZoom (16%) and Maze (14%) based on their specific research needs.
*If we exclude calendar tools and bundle those responses into Google Workspace and MS 365 Office suites, SurveyMonkey makes it onto the list at #10 with 40% of researchers saying they use the platform for research.
In other words, for many UXR teams, User Interviews is considered an indispensable part of their tool stack, alongside do-it-all office suites and tools like Zoom, Slack, and Miro. (Yes, that’s a not-humble brag—we’re thrilled to see it!)
If you haven’t already, go check out the slick, interactive State of User Research 2022 report for tons more insights and data.
Ready to start recruiting for your next project?
Learn more about how User Interviews can help you fill that study in a matter of hours—whether you’re recruiting your own users or looking for a new audience among our panel of 850k vetted participants.