
Who can use this feature?
🗣️ Admins on teams with designated roles (all team members on teams without designated roles)
⭐ Available with all Research Hub and Recruit plans
View Reports for your team
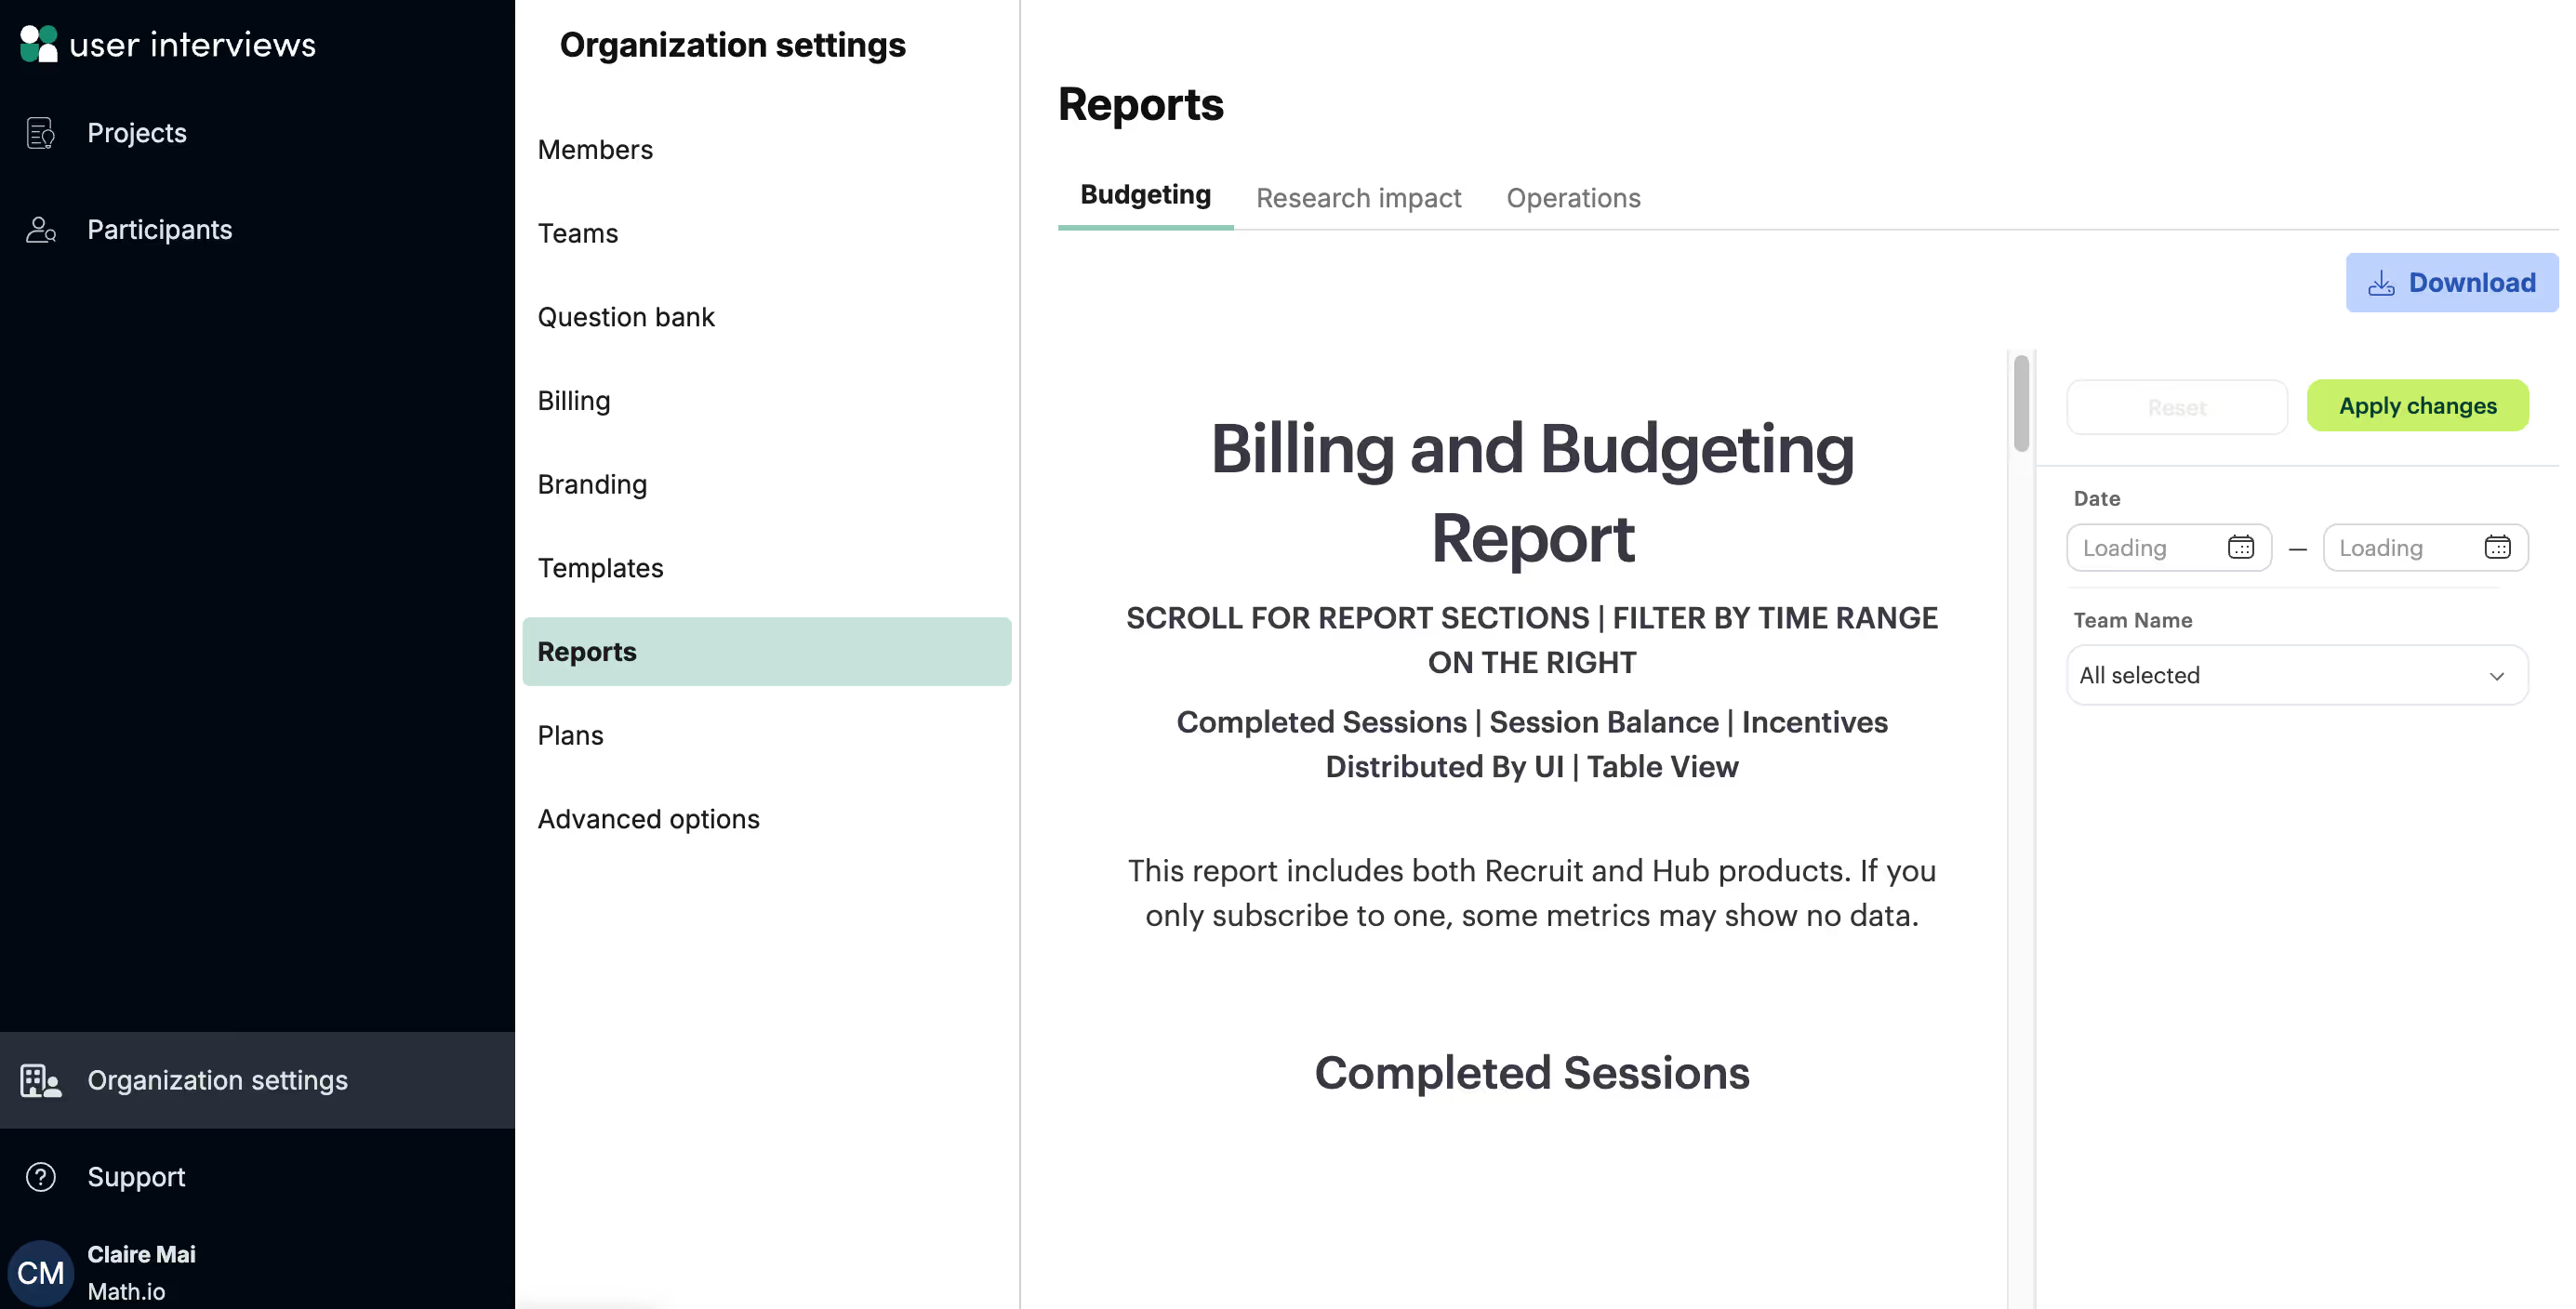
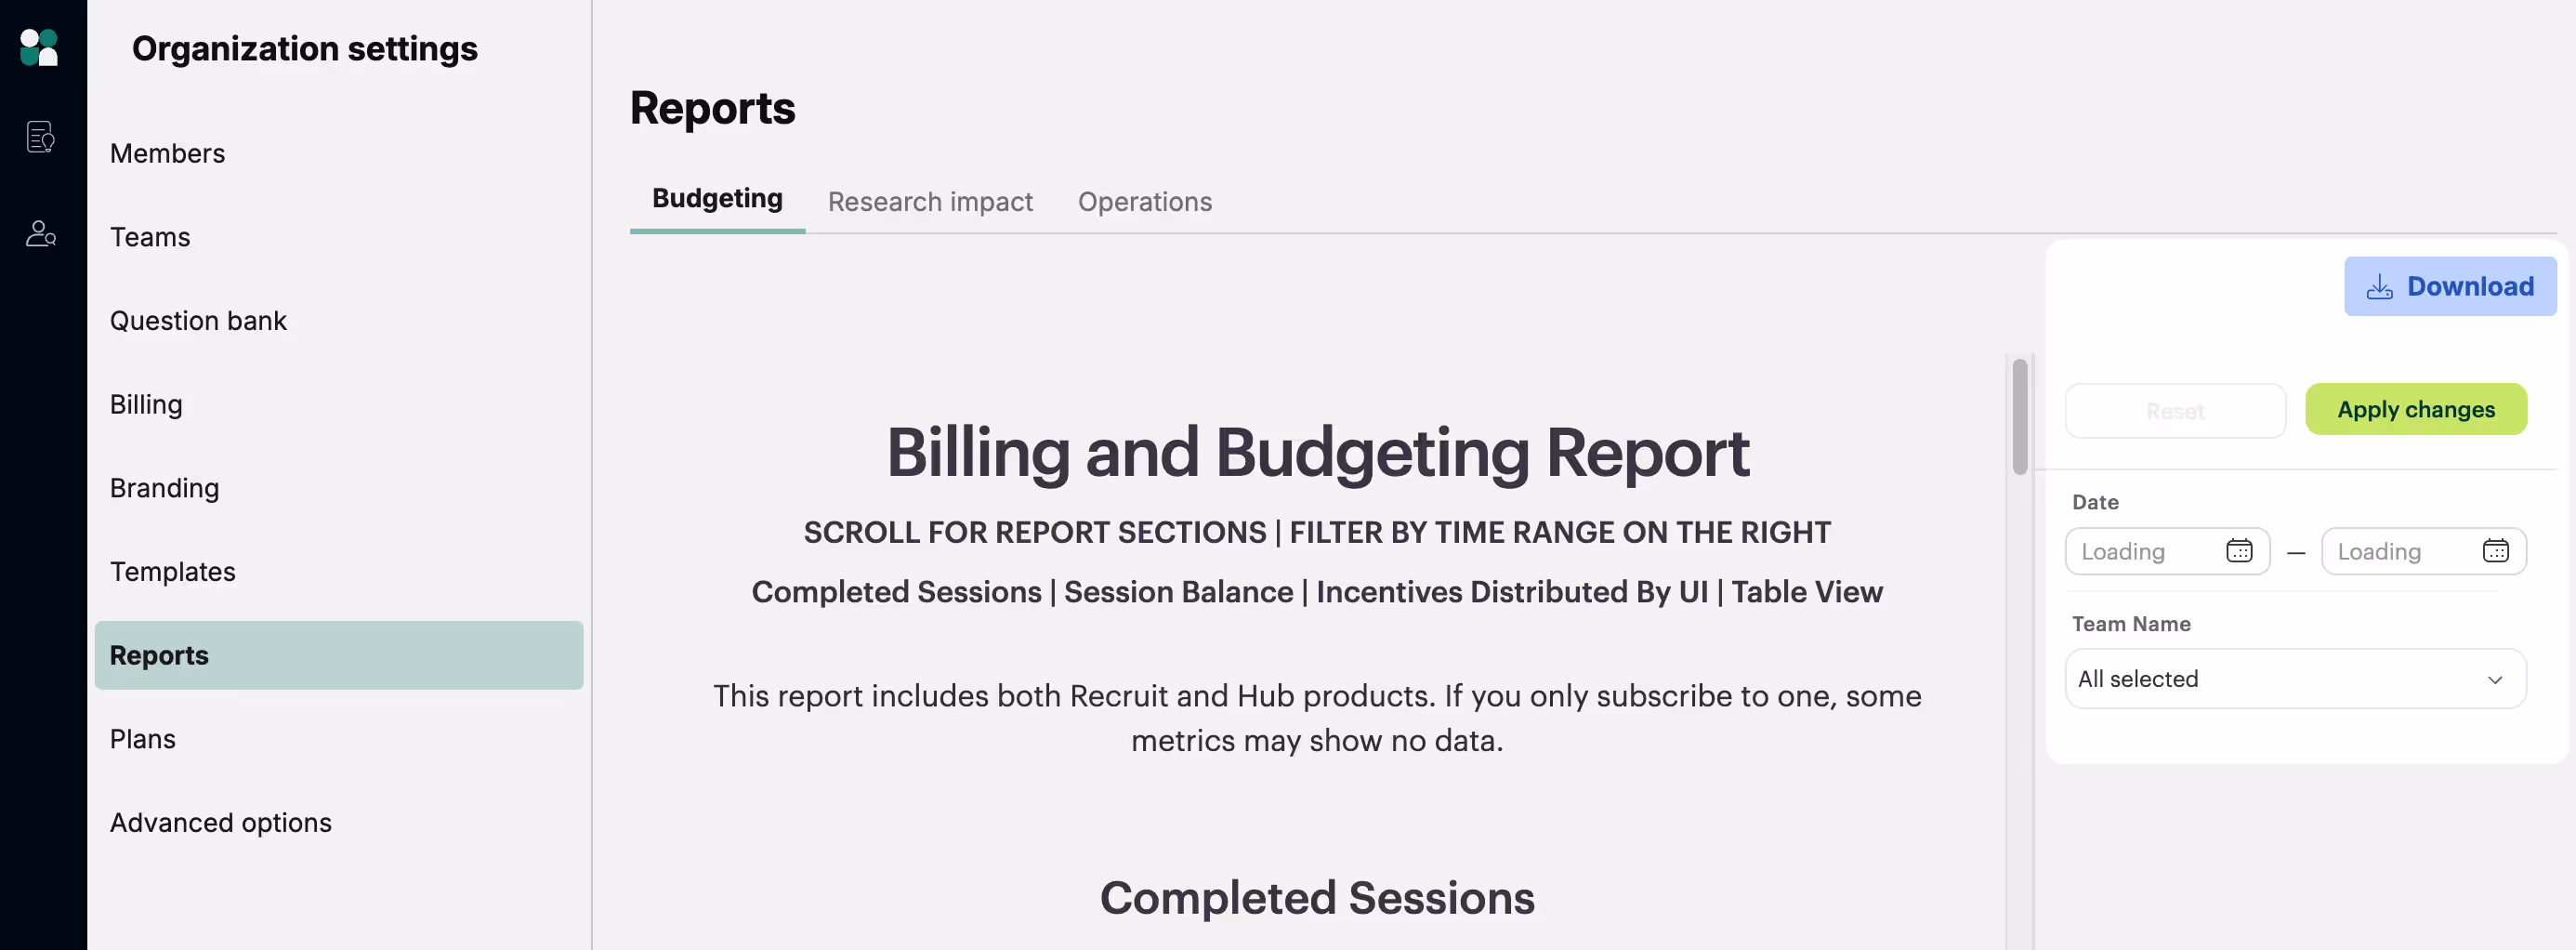
In the left sidebar, click on Organization settings and navigate to the “Reports” tab. Here you’ll see three in-app dashboards: Budgeting, Research Impact, and Operations.
🔐 Note: On teams with roles, the Reports page is visible to Admins and Owners only. If your team does not have roles enabled, everyone will have access to this page. Learn how to enable roles for your team if you want to limit access to this page to Admins and Owners only.
Key metrics
We include three reports to give you instant visibility into org-wide research activity, budgets, and impact. You’ll be able to filter by team(s), adjust date filters, and download the underlying data as needed. ⬇️
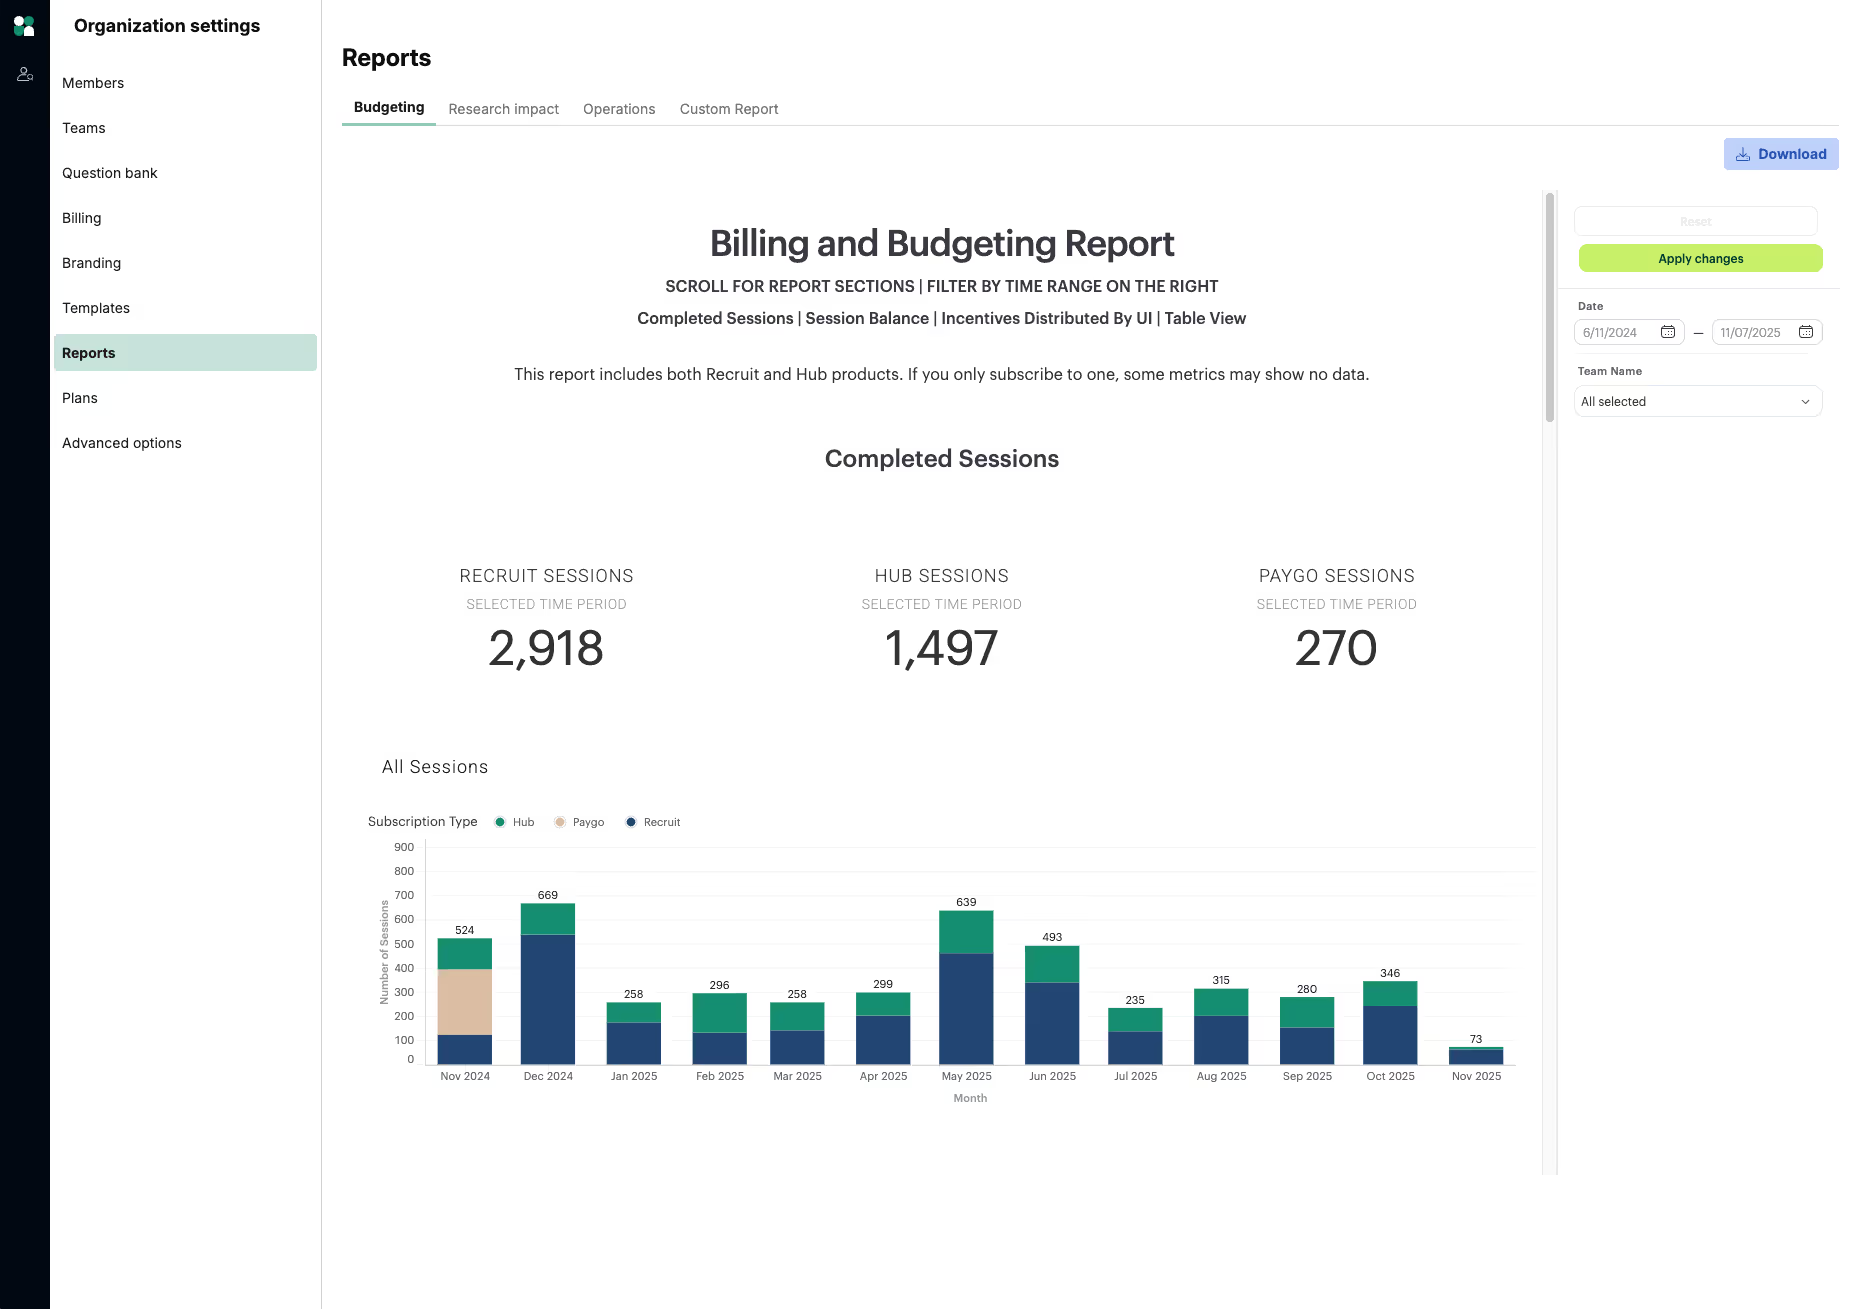
Budgeting
Get full visibility into how your research dollars are being used. Break down session and incentive costs by team or by project to optimize spend. Monitor incentive spend by team, researcher, or project.
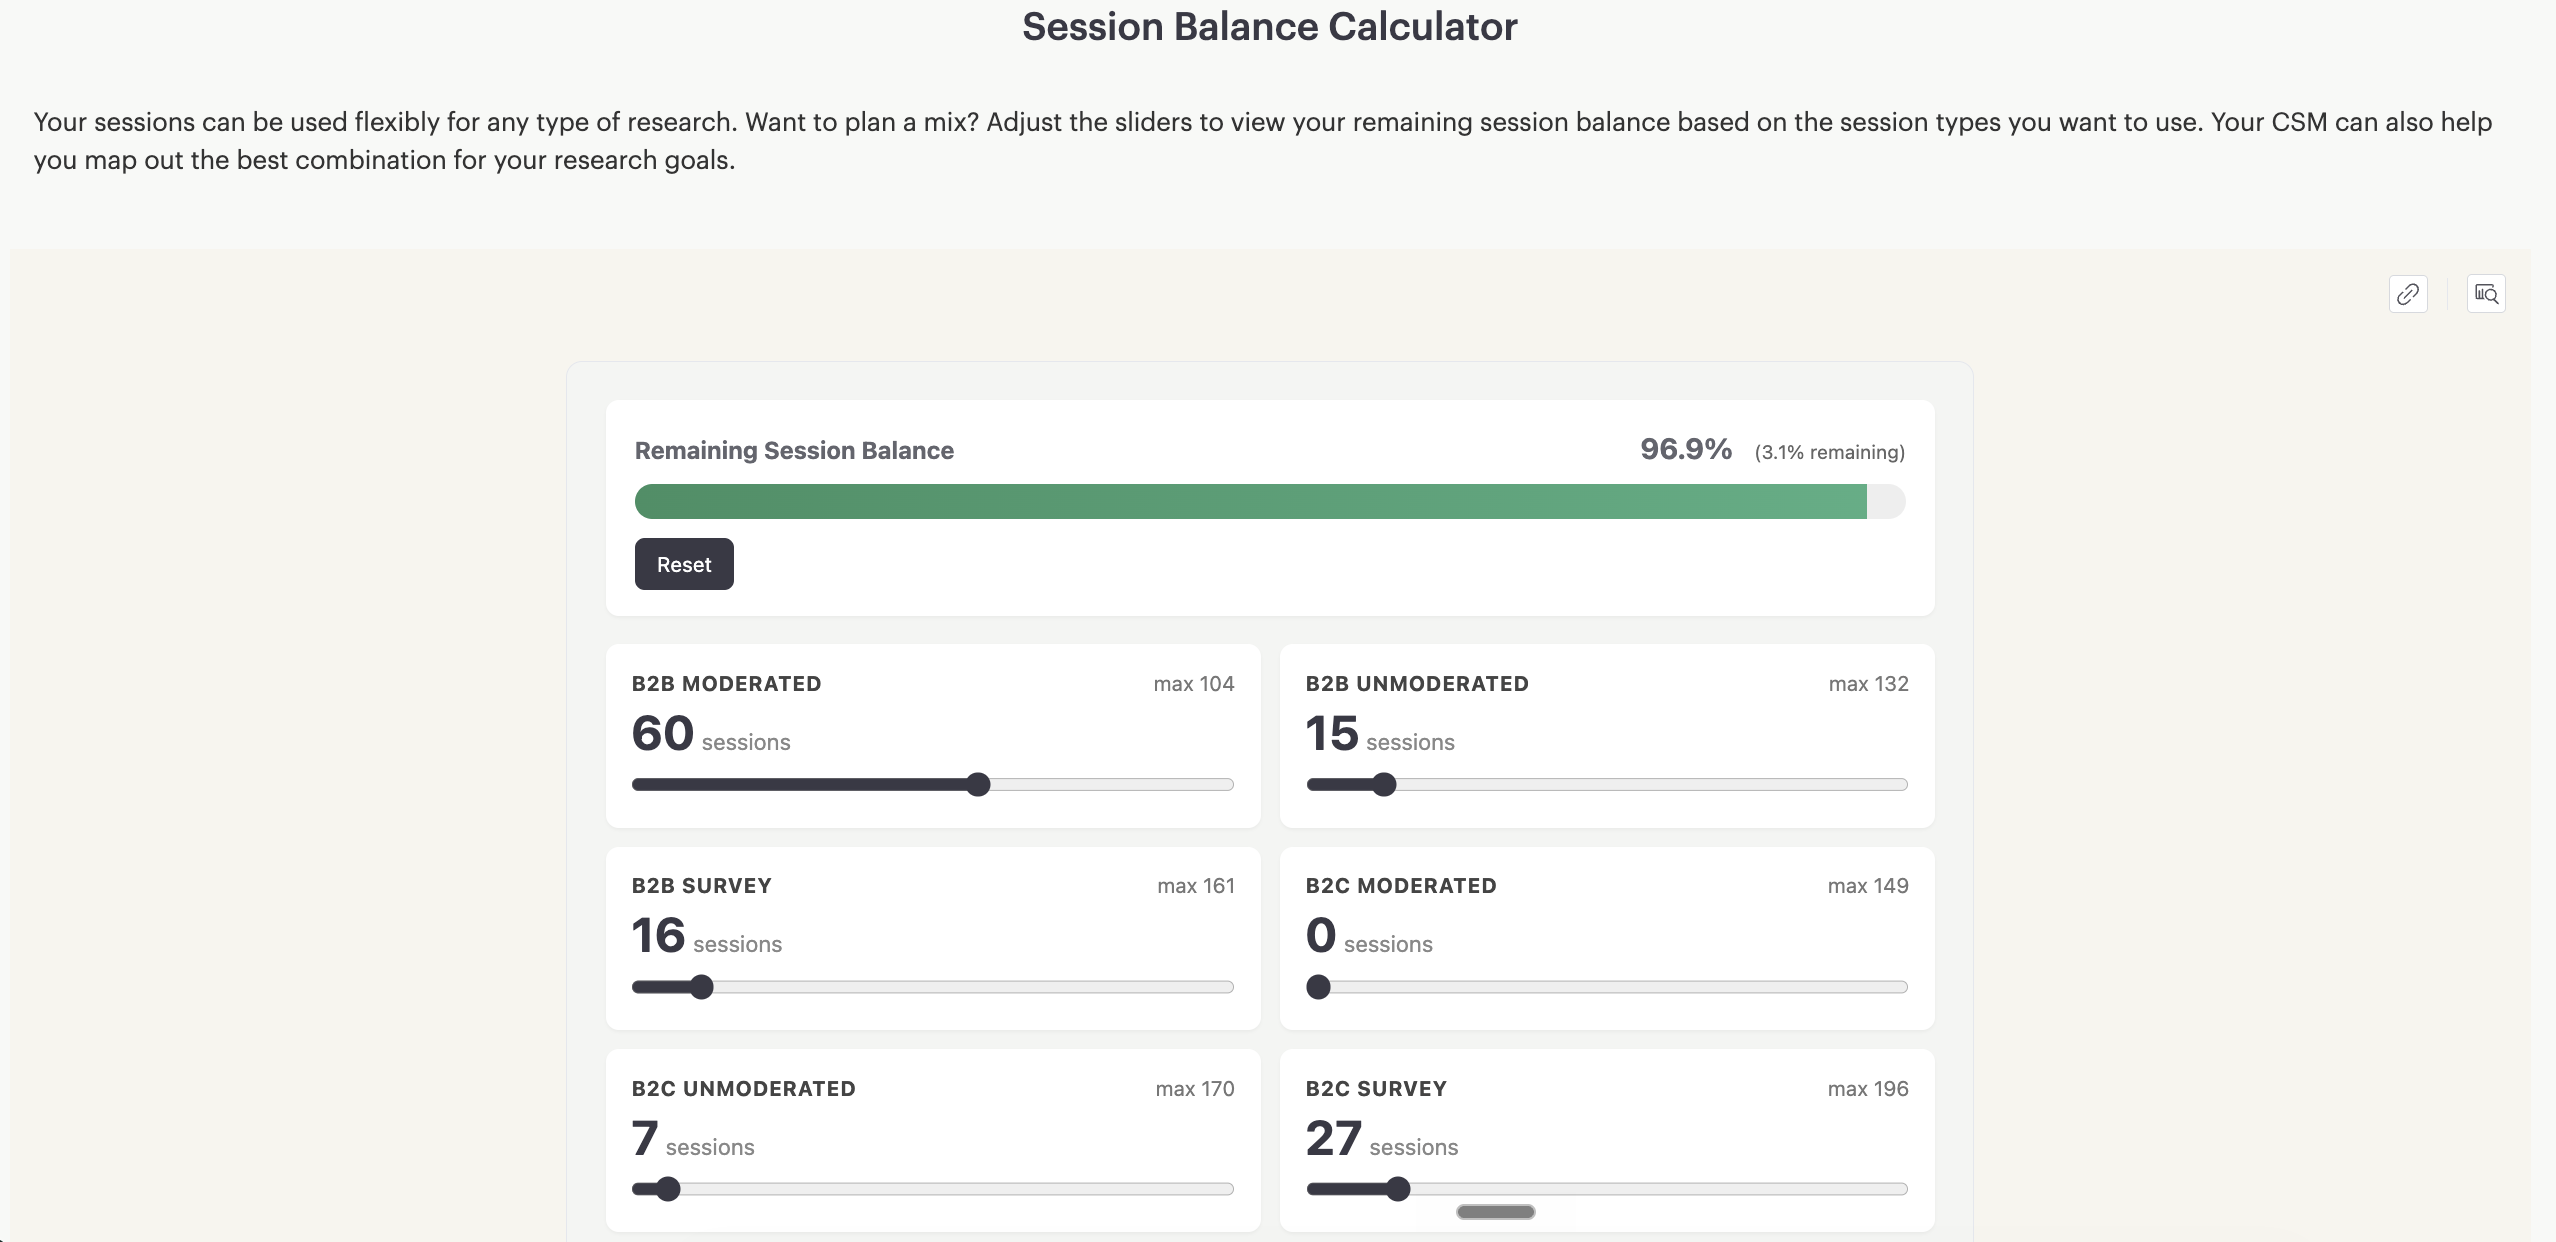
Session Balance Calculator
The Session Balance Calculator shows how far your remaining balance stretches depending on the mix of research you plan to run. You'll find it at the bottom of the Billing and Budgeting report.
The mix matters because not all sessions cost the same. Sessions vary by method (interviews, surveys, unmoderated tasks) and audience (consumers vs. professionals), so the same dollar balance yields very different session counts depending on what you plan to run. For example:
- B2B moderated interviews: up to 2,667 sessions
- B2B surveys: up to 5,156 sessions
Survey sessions are discounted, so you can run significantly more of them for the same spend.
To use the calculator, adjust the sliders for each session type to model different research mixes. The remaining balance bar updates in real time so you can see exactly how your research plans affect your available sessions before you commit.
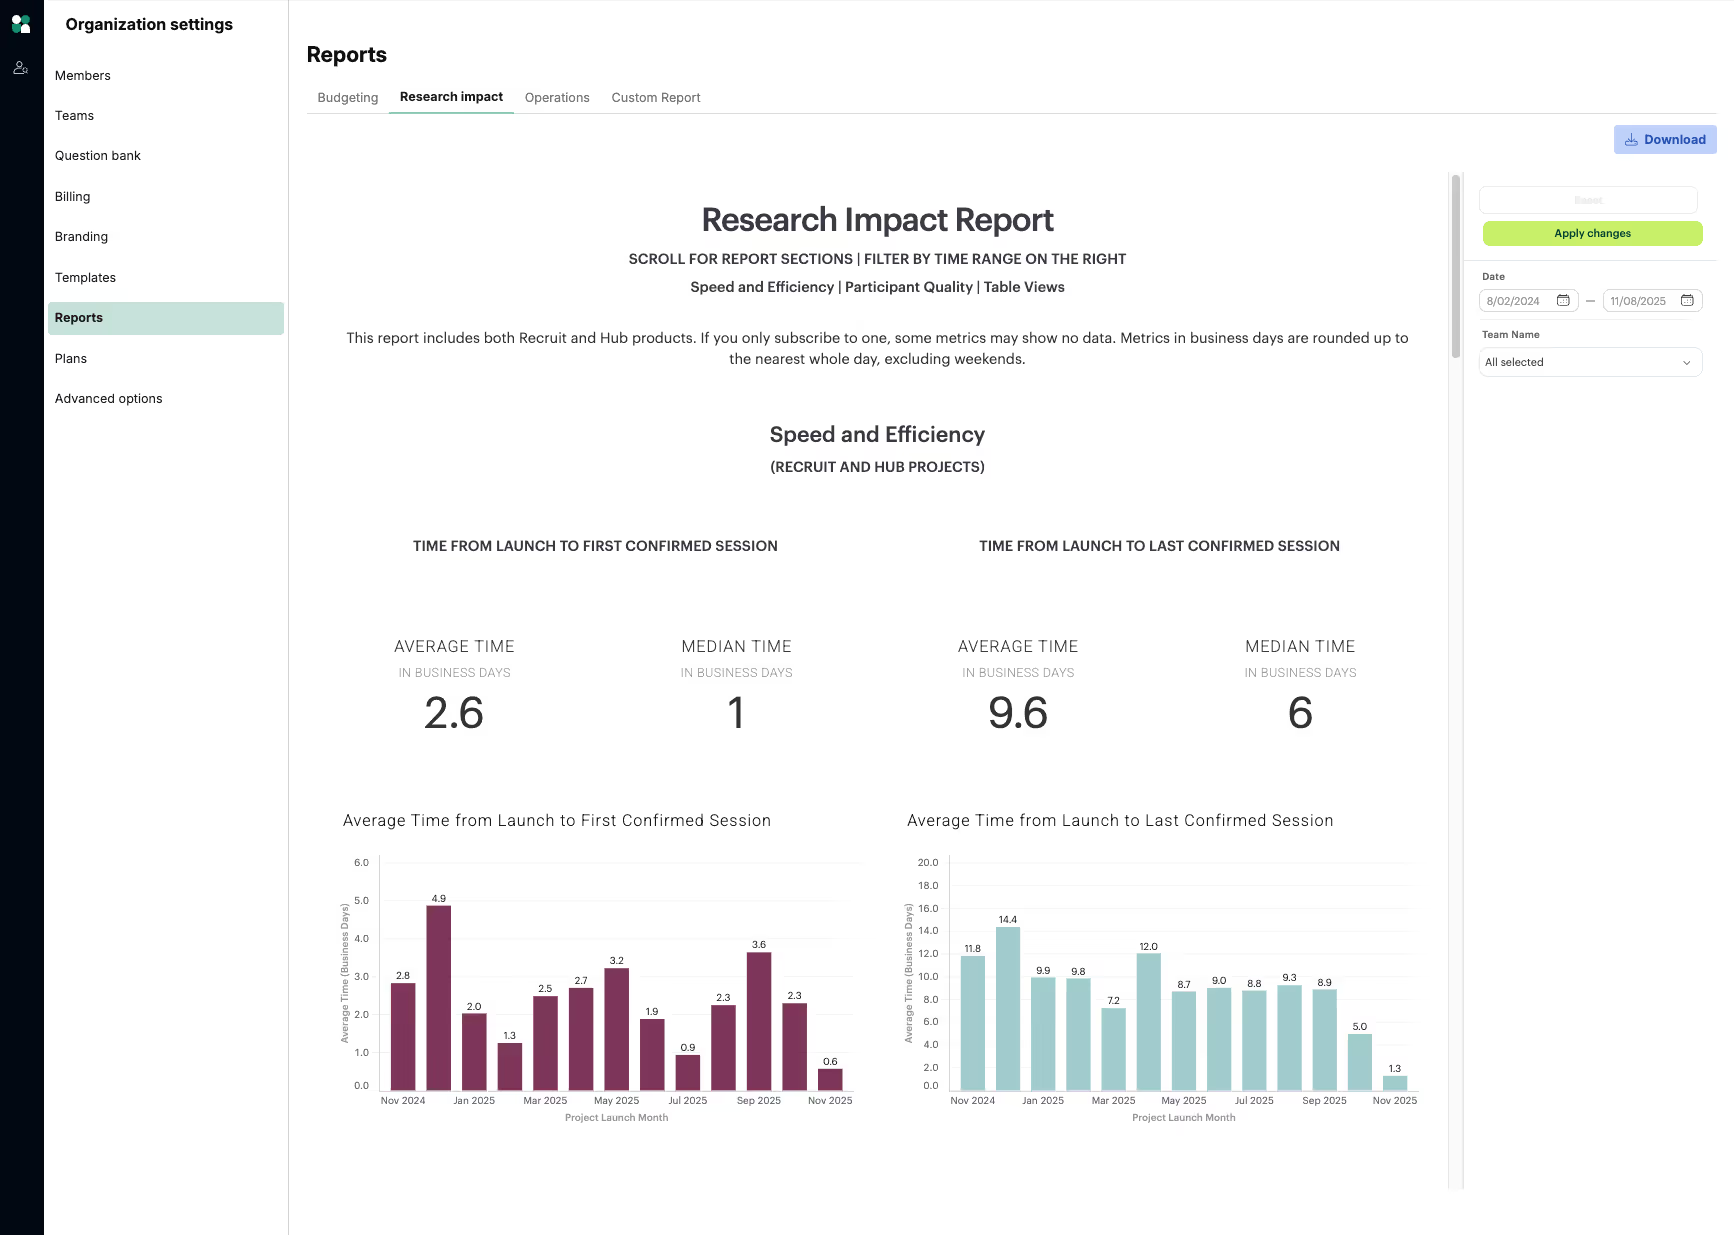
Research impact
Prove the value of your work with data that shows the leverage of User Interviews in your research.
- Dive into research volume, speed, and participant quality ratings from your own team
- Drill down by project, team member, or research type
- See active researchers on your team(s) overall and activity at the researcher level
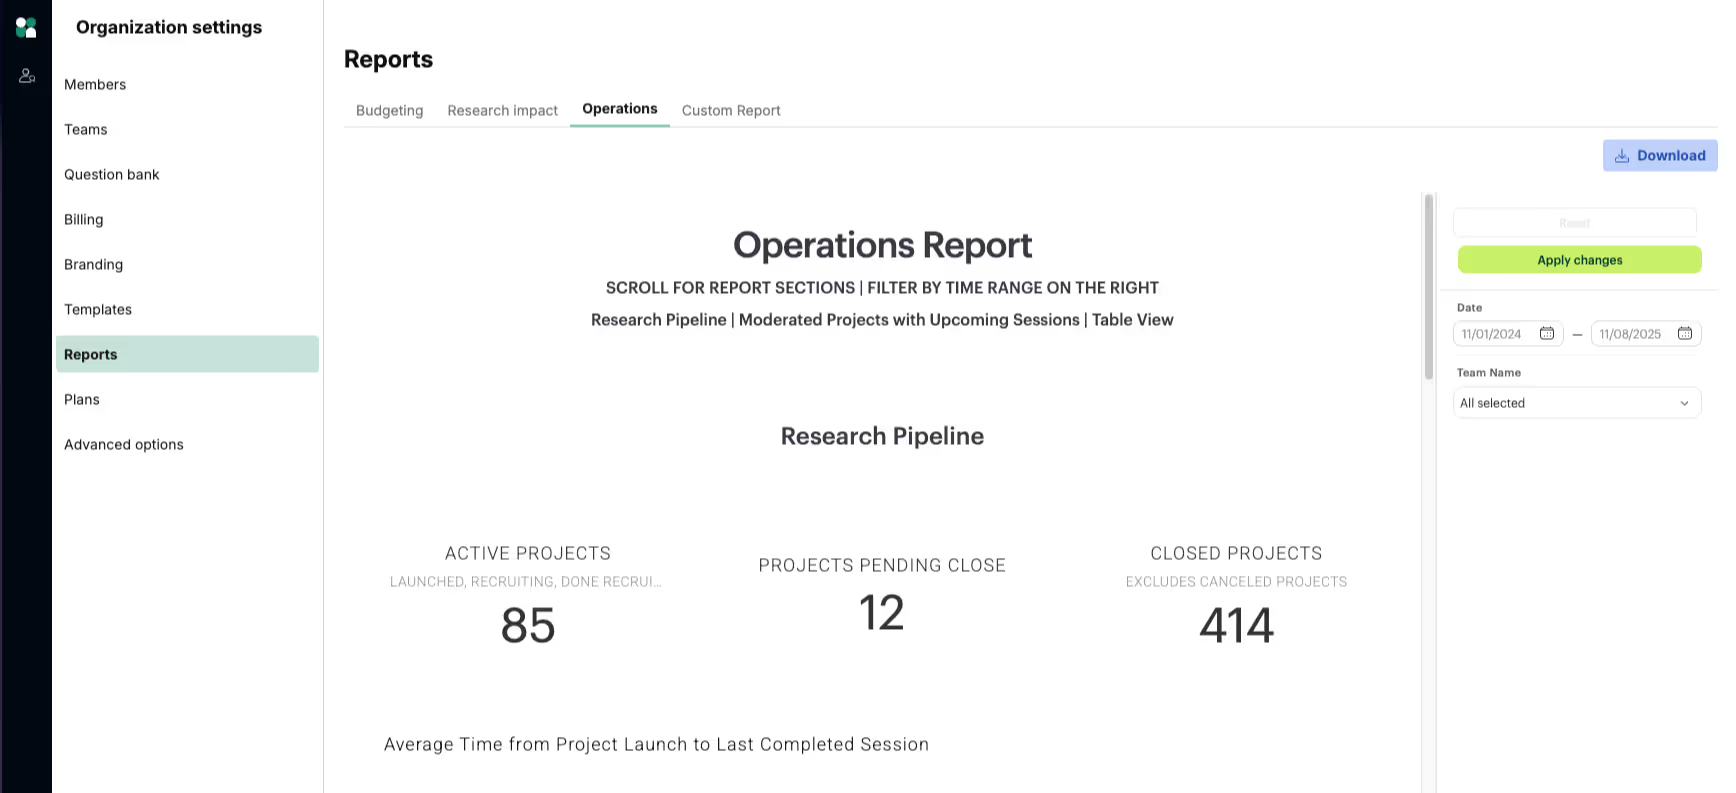
Operations
Your research pipeline at a glance. Your operations dashboard keeps a pulse on active studies, recruitment status, and flags upcoming studies that need attention. Check key metrics such as time from launch to last completed session and see all moderated projects with upcoming sessions in one place.
How to export report data
- Navigate to Reports in the left sidebar (available to researchers with Admin or Owner permissions, or any team member if no roles are defined)
- Navigate to the report you’d like to download
- Click the “Download” button at the top right of the page
- The report data will download as a zip file of all relevant .csvs
FAQ
Who has access to view the “Reports” page?
On teams with roles, the Reports page is visible to Admins only. If your team does not have roles enabled, everyone will have access to this page. Learn how to enable roles for your team if you want to limit access to this page to Admins and Owners only.
Who has access to download the detailed data reports?
On teams with roles, only researchers with Admin or Owner permissions can export the raw data.
Are in progress projects included in the downloadable data report?
The report only includes projects that were completed during this timeframe. It does not include projects that were in progress, but were not marked complete.
What data is included in the downloadable data report?
Data included are the underlying data per report and vary by report. Across all reports, data can be pulled for up to a year prior.
Why doesn’t the # of completed Recruit sessions I’m seeing match my actual # of completed sessions?
The # of completed Recruit sessions shown is the literal number of sessions or tasks marked complete in the UI platform. It does not get adjusted based on special pricing for specific types of projects or audiences you may have. You can check your remaining sessions balance with pricing adjustments taken into account on the Plans page.
Does the incentives data shown reflect both incentives distributed by UI as well as outside of UI?
The incentives data reflects only the incentive amount distributed by UI. It does not reflect how much was distributed by your team.
💡 Questions? Please email support@userinterviews.com


