Note to the reader:
This part of the field guide comes from our 2019 version of the UX Research Field Guide. Updated content for this chapter is coming soon!
Want to know when it's released?
Subscribe to our newsletter!
UX design is both an art and a science.
Like all art, the creative and emotional elements of UX design can be a bit tricky to evaluate subjectively. If you ask your users, “which design is best?” they might choose a design based on personal preferences that have no bearing on the specific product and business goals you’ve set out to achieve.
Preference testing can help you err on the side of science to ensure your designs are not only attractive, but also usable, practical, and profitable.
At the most basic level, preference tests ask study participants the simple question, “this one, or that one?” Handled carefully, that simple question can uncover useful insights about which designs resonate most deeply with an audience, which in turn can inform definition decisions that help guide further design development.
Preference testing output may include qualitative data, quantitative data, or a combination of both. Researchers analyze this data to create a summary, which provides specific recommendations for the next phase of designs.
People often confuse preference testing with A/B testing, but the two are actually very different. Preference testing is done very early in the design process, usually with sketches, wireframes, or preliminary designs. A/B testing, on the other hand, comes much later in the process when the design is close to final and the product or website is interactive, allowing participants to perform various tasks.
Preference and A/B testing also study different aspects of a design. Preference testing focuses on perceptions and opinions while A/B testing focuses on behaviors. Preference testing data, therefore, tends to be more qualitative, while A/B results are tied to KPIs related to defined user goals.
Some researchers have pretty strong reservations about the value of preference testing. While it’s meant to help designers progress a design forward in a way that aligns with user preferences, the nature of the process can work against that goal.
As author, entrepreneur, and Carbon Almanac Founder Seth Godin explains:
“Some objective measures of new names and concepts are worth knowing about before you launch. Seeing what search results look like, understanding the trademark register, having insight about pronunciation and language issues.
But general ‘how does this make you feel’ feedback on a new concept is almost certain to give you exactly the wrong feedback.
That’s because the idea isn’t going to work because it’s objectively, obviously and completely better. It’s going to work because the network effects and cultural dynamics behind it push it forward.”
Although it can seem like a simple task to get people to tell you whether they prefer Design A or Design B, it’s really easy to wind up with inaccurate or incomplete data. And if design iterations are based on faulty findings, they can go off the rail pretty quickly.
Here are three of the top challenges intrinsic to preference testing:
The bottom line is that no one should rely solely on preference testing to make critical design decisions. Preference testing can, however—especially when combined with other research methods—be a helpful way to gain initial design insights during the early stages of development.
Despite its potential weaknesses, there’s one very good reason to conduct preference testing: desirability.
Desirability and usability are like the two sides of the UX coin, both of which are necessary in a successful product.
Usability focuses on the functional side of the user experience. It’s all about whether and how easily users can complete various tasks. Desirability encompasses all the intangible elements of the user experience—the “something extra” or “wow factor” that makes the experience more pleasurable and can help to create and sustain an emotional bond with the user.
In competitive markets, desirability is not just a nice-to-have, it’s an essential part of a winning growth strategy. First, it provides an advantage with first impressions since a design with high desirability often correlates to a more positive perception of usability and overall credibility. This halo effect can give a product a critical leg up with prospective users to drive adoption, and can even play a role in persuading existing users to forgive usability flaws.
Second, high desirability is one of the attributes that gives a company the ability to charge a premium for its product. It’s the part of the experience that people will pay extra for because it enhances their experience in a way that evokes an emotional response.
One of the biggest benefits of preference testing is the fact that you can use it very early in the design process. It can be performed with fairly simple renderings of design variations, or you can use it to compare a proposed design to a competitor’s.
The strength of preference testing is its ability to provide quick input that can help determine the most viable design direction to pursue, and also provide insight into why users prefer that design over other options. Preference testing can also be done iteratively as a design evolves, acting as a checkpoint at key junctures.
The key to getting the most out of a preference test is to go beyond the basic, “which one do you like better?” question. You want to dig deeper by asking follow-up questions that get below the surface quantitative data into the qualitative responses that help you unearth the ‘why’ behind participant preferences.
So, when you’re designing a preference test, there are three elements to consider:
Specificity is crucial in all three of these areas.
The purpose of preference testing isn’t to get an answer to the question, “which is the best design?” First of all, unless you have recruited a panel completely composed of expert designers, your study participants won’t likely be qualified to answer that question. All they will be able to provide is their opinion about which design they like better.
Even the question, “which design do you prefer?” is not always extremely helpful, at least not on its own. While it does put the participant back on solid ground—asking them about their own preferences, about which they are an expert—it’s still too general to offer much constructive feedback.
Instead, think about what question you’re really trying to answer in the context of what you’re trying to accomplish with the design. For example:
The idea is to isolate specific points of comparison related to the specific design challenges and objectives of your project.
You also want to establish early on whether you will be collecting qualitative or quantitative feedback.
A preference test can be used to compare and evaluate different design layouts, wireframes, color palettes, logos, sound files, videos—pretty much any design element you can think of. You can even mix-and-match different asset formats if that’s the best way to get at the answer you need.
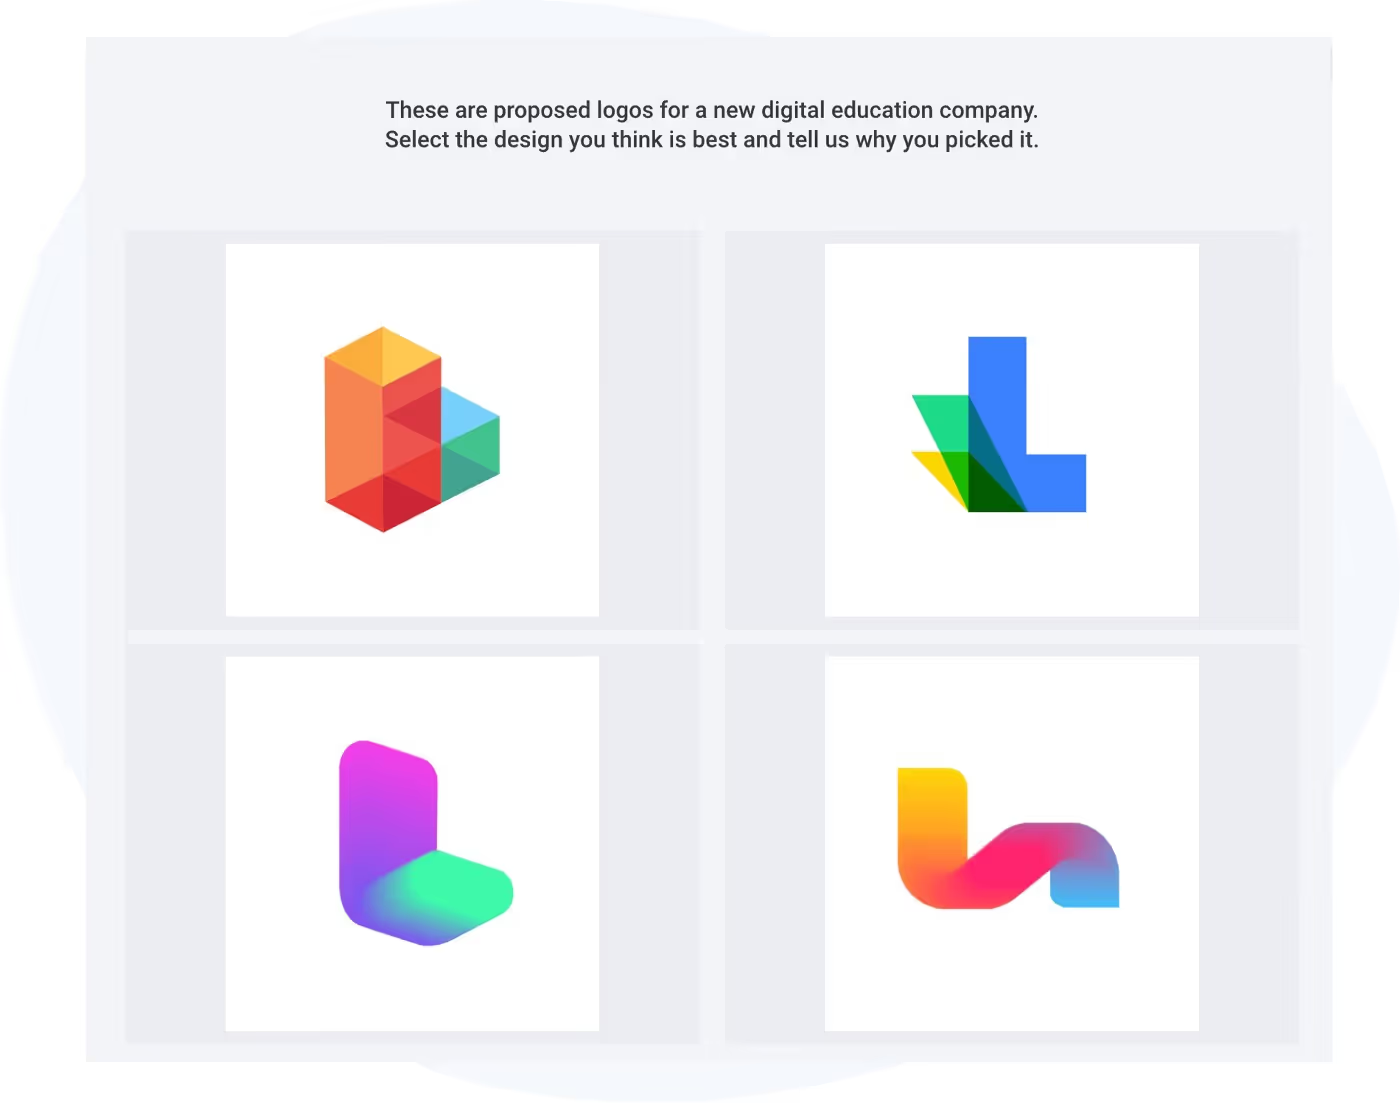
The typical process for a preference test is to first provide participants with an overview of all the designs in a side-by-side format. After you’ve given them this high-level perspective, you then ask them to look at each design on its own in more detail before they make their final selection.
One common pitfall is asking participants to choose between very similar designs. If the differences are too nuanced, non-designer participants may have trouble figuring out what they are looking at unless you point it out. In some cases—if you are at that level of design refinement—you can, in fact, crop design images to help participants focus on the detail in question.
Good follow-up questions make a big difference in the usefulness of your preference testing data. It’s one thing to know which design people prefer, but it’s much more helpful to understand exactly why they prefer that design.
You can ask follow-up questions within a digital test interface, or you can conduct quick interviews. And you can use almost any kind of question structure, though you will get the richest responses using an interview or open text field option.
Here are some of the ways you can use follow-up questions to layer additional insights into initial findings:
When asking follow-up questions, whether in person or on a digital testing platform, make sure that the participant can view the question and the relevant design at the same time. This allows them to refer back to the design as they formulate their answer, and will ensure more detailed and specific responses.
While this method can prove a little trickier to manage in terms of analyzing and presenting results, it can be an effective way to evaluate design perceptions free from any researcher bias. Participants are asked to assess three design options and select the two that are different from the third, and explain why. The goal of this kind of exercise is to identify which attributes participants hone in on when comparing different designs.
As design leader Michael Hawley says in UXMatters:
“This process helps the researcher to understand what dimensions are important to target users in comparing different designs. We’ve found this method to be very helpful both when evaluating the competitive landscape and for assessing different conceptual options from an interaction design perspective.”
However, he also warns about some limitations with this method; it may not be the best option when you’re using large sample sizes, and it can be difficult to present the results to stakeholders and help them understand how to use these insights to choose the best design.
Sometimes called “5-second tests” because that’s how long participants have to view each design, Impression tests are especially helpful for assessing static design elements like landing pages, individual images, or ads.
After the image is shown, participants answer questions about their first impressions as well as what information they retained about the content. This type of test is often used to validate that an asset is able to convey a clear message quickly and consistently.
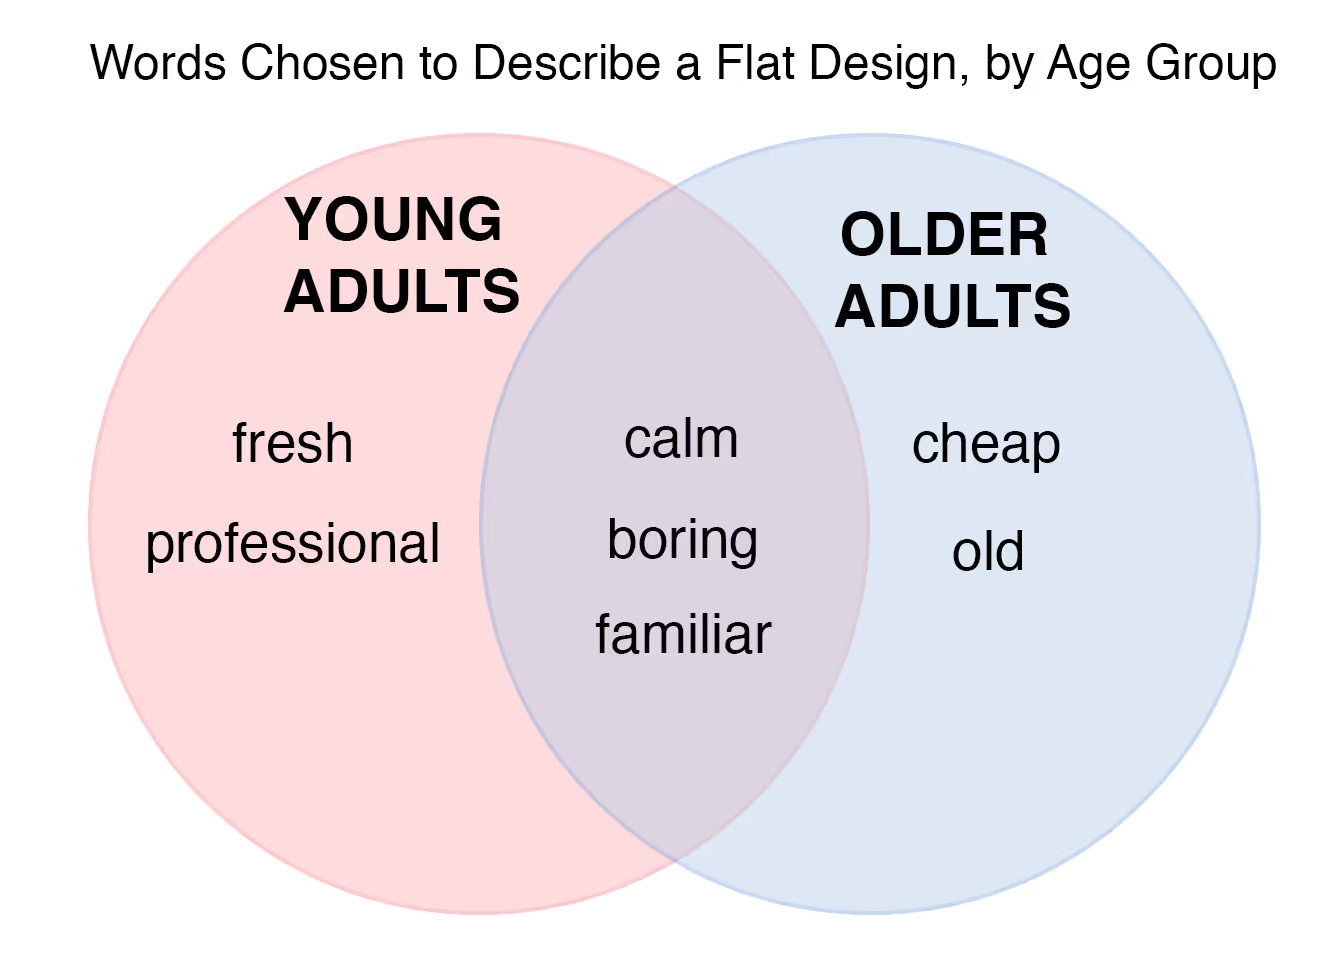
In 2002, two Microsoft researchers shared a technique they developed to measure desirability using a deck of 118 cards with different adjectives on them. Sometimes called “The Microsoft Reaction Card Method,” this approach to preference testing is a useful method for gauging participant responses to a design’s aesthetic qualities in a way that’s easier to analyze because it uses a defined vocabulary for all participants.
The process involves selecting a subset of the 118 adjectives (usually about 25 or so) that are relevant to the design(s) being tested. The goal is to include a variety of words—positive, negative, and neutral—some of which you believe are applicable to your design, others that you believe don’t apply.
In the test, participants are asked to sort the cards into two columns, one containing the words they believe apply to the design, one containing the words they think do not apply to the design. You can analyze the results using a word cloud or frequency chart to highlight trends.
The markup method is an interesting technique that borrows some elements of co-designing in a more interactive test format. Used primarily for designs that lean on both visuals and text to communicate value, this method involves having a participant review a design and then mark it up with symbols or colors to indicate which elements work for them, and which elements do not.
In addition to having participants physically mark up a design, it’s important to have them use a “think aloud” approach to verbalize why they are putting certain marks in certain places.
After the test is complete, you can use a heatmap to aggregate responses and identify a design’s weak and strong points. For more information about the markup method and other preference test methods, check out this resource by Researcher David Peter Simon on Dropbox Design.
While less frequently used, researchers are learning more about how physiological indicators can provide insight into a participant’s genuine emotional response.
This type of research requires expensive equipment that measures brain, muscle, and other physiological activity that can be correlated to different emotional states. For example, Electromyography (EMG) measures muscle activity related to excitement levels, and Blood Volume Pressure (BVP) measures blood vessel dilation, which relates to arousal. These types of techniques are most often used in combination with a self-reporting method.
To ensure that results have statistical significance, preference tests should be run with approximately 20 to 30 participants. The panel should not only reflect your usual target audience, but also consider the specific context and mindset that will be relevant to the design in question. So, for example, if you are testing a design that is intended to appeal to new prospects, you may want to recruit non-customers who still fit the profile of your typical user.
If you’ve collected only quantitative data, analysis is a quick and simple task of tabulating responses to discover which are most common. If you have collected qualitative data, the process is a little more time intensive, involving text analysis to group responses into categories and identify patterns that point to specific insights.
In either case, if there is not enough difference in the preference for one design over another, you can repeat the test with a modified version of the design to see if you can achieve more definitive results.
In cases where you are looking at quantitative data, there are a couple of ways to analyze the data to get a statistically significant result:
Here’s a list of specialized tools for preference testing:
You can pair these tools with your core tech stack and conduct many types of preference tests with these more general moderated research tools:
For a closer look at the tools researchers are using for preference tests and other methods over the years, see the toolkit results from our State of User Research reports.
Because preference testing is inherently subjective and can deliver superficial insights, it’s best to pair it with other methods such as interviews and/or questionnaires in order to capture more in-depth qualitative data that can help clarify the reasons behind participant choices. It can also be paired with A/B tests and behavioral analytics to provide additional quantitative data.

Schedule your demo and see us in action today.


