Note to the reader:
This part of the field guide comes from our 2019 version of the UX Research Field Guide. Updated content for this chapter is coming soon!
Want to know when it's released?
Subscribe to our newsletter!
User analytics gives you insight into how your product is actually being used, out in the wild.
Most product teams are already collecting some form of user analytics, perhaps in the form of passive usage data or website behavior. But what many teams aren’t doing yet is using user analytics data for UX research too!
Here, we’ll provide concrete, actionable advice for using the user analytics that teams are already collecting to answer user research questions and support continuous (qualitative) research.
User analytics (a.k.a user behavior analytics) is a form of continuous, quantitative data tracking and evaluation that occurs post-launch. Teams use analytics tools to passively collect data about active users’ interactions with their product, app, or website across browsers and devices (mobile devices, desktops, tablets, etc.). Then, they analyze this data to gain insights into user behavior and better understand user engagement, sentiment, and the overall customer experience.
UX researchers and PwDRs (people who do research who aren’t part of the core UXR team, such as marketers, UX designers, product managers, and engineers) can use user analytics to:

To understand the difference between user analytics and user research, it’s helpful to review the difference between qualitative and quantitative research:
User analytics typically offers quantitative insights; it gathers numerical data from large sample sizes, usually passively through tools like Qualtrics or Google Analytics. User research, on the other hand, offers richer qualitative insights into user behavior, digging into the reasons and motivations behind actions.
As Yaron Cohen, Senior UX researcher at RBC, says in his article about collaboration between user researchers and analytics specialists:
“Analytics professionals spend their days extracting transactional and behavioral data from databases, and analyzing data that was recorded by electronic systems and not provided by the customers themselves (implicit data)...UX researchers, on the other hand, work with explicit data provided by customers in the form of surveys, interviews, and usability studies.”
Despite (and because of) their differences, UX research and analytics make a great pair. Used together, insights from each can inform holistic customer personas, pinpoint the causes of churn, and reveal opportunities to improve retention rates, product usage, and conversions.
Quantitative user analytics are important to all organizations, with different departments and functions monitoring what is most relevant to their needs.
For example, the C-Suite is likely watching top-line metrics, like daily, weekly, and monthly revenue, plus whatever key metrics drive that revenue. Marketers are focused on metrics that drive revenue throughout the entire funnel. Product teams are focused on product usage and user-centric metrics that help drive that usage (and ultimately revenue).
Whoever the person or team, the beauty of rallying around quantitative metrics is everyone can speak the same language in a pretty objective way. In the context of ongoing listening following a product release, you probably have some historical benchmarks to watch post-launch, focusing on the areas you were trying to impact. Mapping user goals, to product goals, to revenue goals, to quantitative metrics is an important way to align goals across an organization.
In other words, user analytics can help you:
Note that often, pairing quantitative methods with qualitative methods like user interviews can reap the best, most well-rounded results.
Here at User Interviews, we’re pretty enthusiastic about all forms of research, including user analytics. However, like any research method, user analytics comes with both pros and cons.
As our own VP of Analytics, Utsav Kaushish, previously said in his article, “I’m a Data Scientist and Here’s Why Quantitative Data Isn’t Enough”:
“I know firsthand how valuable analytics can be for a company; I’ve literally made a living from it. But I also know of its limitations; there are times when you have to dig deeper than possible with a query or a regression model. And often the best way to do this is to simply talk to the people you want to use your product. A truly data-driven organization will complement their analytics with user research, and use learnings from one to power the other.”
You’re probably already collecting some form of user behavior data at your organization, in which case, some of these steps will be review for you:
However, let’s start from the beginning for folks who want a refresher.
Begin by understanding your user’s goals.
For example, if you’ve created an experience in a fitness app for someone who wants to get lean, you need to understand which actions are the most important for meeting this goal, then track the ease with which folks can complete those actions.
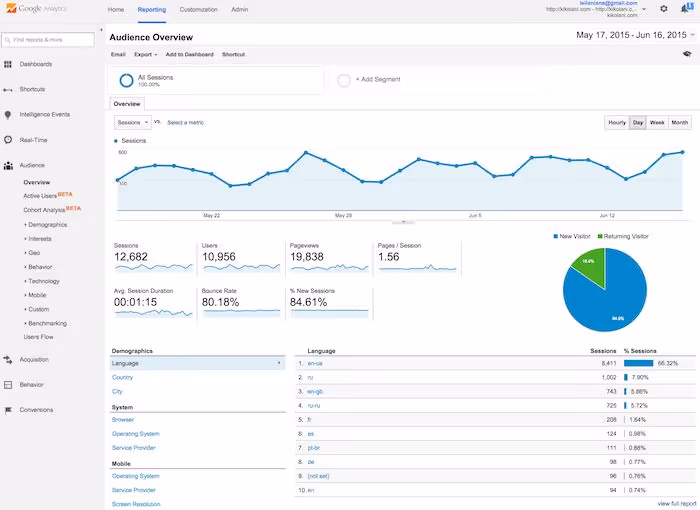
So, how do you know when someone’s having trouble? Sometimes users give you feedback directly through a survey or support interaction. Other times the writing is on the wall in the form of quantitative analytics—like Google Analytics for web, Mixpanel for product events, or other tools in your analytics stack.
Depending on the goals of your product launch or feature updates, you may want to focus on some of the common quantitative metrics and data-gathering methods and technologies below.

NPS, CSAT, or CES scores
These survey metrics give you an idea of how your customers feel about your company and particular touchpoints with your company, such as the customer service and support experience.
If these scores are changing (positively or negatively) following a launch, this can be an indication of how your changes are being received.
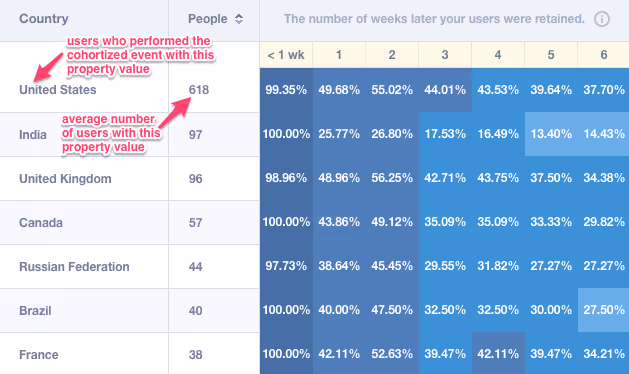
Drilling into your data with a focus on key segments and cohorts, and validating with further data will help you uncover insights into user behavior.
Qualitative survey data
Often the above surveys include a free-form question that can help you understand some of the whys, the motivations behind the positive or negative scores.
As you combine quantitative data with qualitative and segment it by meaningful customer groups, you should start to form hypotheses you can then validate through testing and further research.
By understanding and tracking your baseline against the metrics that matter to your goals and your users’ goals, you’ll quickly notice where a product update or launch is having an impact.
Session replay tools are a type of user analytics that offer both quantitative and qualitative insights. Like the name implies, these tools capture and create a video-like recording of real app or website users’ sessions to show how they navigate across your company’s digital experiences. Session replay tools offer a look at what happens during these user journeys, such as:
Some session replay tools also offer AI-powered summaries of these interactions, offering qualitative insights that reveal how customers feel about what happened and an analysis of user sentiment during their app or website journeys.
This type of solution can be a useful addition to your user analysis strategy as session replay tools can pinpoint where users are encountering:
Once you've determined the metrics you need to track, audit the user analytics systems teams are already using and look for any gaps in capabilities.
Some user researchers build out custom dashboards, integrating Google Analytics with Microsoft Excel, or taking advantage of one of the many business intelligence tools now available.
Tracking data doesn’t have to be a heavy lift. We recommend automating as much as possible your dashboards to streamline your workflows. This way, you can spend less time collecting data and more time analyzing and acting on it. Make sure to share your dashboards with other stakeholders too!
Perhaps you have a weekly department meeting where key metrics review is a recurring agenda item.
Or maybe you have a monthly OKR meeting.
Or maybe you are the lead researcher on a particular project you’re very invested in, and you need to know what’s happening by the day or hour on something that has just launched.
Depending on your individual, team, or company situation, set up a regular cadence for reviewing the metrics that matter to you the most. Of course, it may make sense to review different metrics at a different cadence.
We recommend a weekly check-in of your top level key metrics at a minimum, and then build from there based on your needs. Give yourself a recurring task or calendar event to make this ongoing review a habit or take advantage of automated email reports for your services that offer them.
As you’re reviewing your user analytics data, you may uncover patterns and other points of interest that can inform, spark, and eliminate the need for future qualitative studies.
Be sure to:
User analytics data will likely leave you with a list of unconfirmed hypotheses about product improvements and unanswered questions about user motivations.
Qualitative research comes in to answer those questions. AP Intego’s Cat Anderson explains this interplay between quantitative and qualitative data on Awkward Silences:
“We use quantitative to inform our qualitative round. An example of that is when we draw from FullStory, the platform where you can [use session replay to] record the screen as somebody's using your app or your website….
After watching hundreds of people struggle on this one interaction, we were then able to design a qualitative research round that really put it into a more holistic perspective and context for us: Why? Why is this a difficult step for you? Oh, well, it's because of all these other things that are happening around it in a small business owner's life or in a small business owner's journey.
That was an example of… the quantitative informing the qualitative. And then, there's just a whole lot of complex interplay between those moving forward as we do new rounds of research.”
If you’re already collecting user analytics data at your organization, you might already be familiar with the most popular user behavior analytics software, such as:
User analytics and UX research make a great team.
By analyzing quantitative user analytics data—and pairing it with qualitative data from UX research—you can identify areas for improvement, create exceptional user experiences, and ultimately increase retention and revenue.

Schedule your demo and see us in action today.


