Note to the reader:
This part of the field guide comes from our 2019 version of the UX Research Field Guide. Updated content for this chapter is coming soon!
Want to know when it's released?
Subscribe to our newsletter!
Communicating your findings is arguably one of the most important (and difficult) skills to hone as a User Researcher.
Yes, you’ve done the difficult work of moderating interviews, analyzing months of diary study entries, or scouring spreadsheets for significant trends—but all that work withers away when stakeholders never hear about it, understand it, or use it.
Research reports and presentations are your opportunity to showcase the results and significance of your work for the rest of your team.
Let’s talk about what reports and presentations entail, and how to get them right.
A research report is a document that summarizes all the details of a research study, including the research questions, methodology, notable insights, and recommended next steps. The main purpose of reporting in UX research is to communicate findings to stakeholders and provide accurate, objective insights that inform next steps.
You’ve probably written some form of research report in other settings like school or more formal scientific environments, but the reports you’ll write as a UX researcher are a little different. Traditional reports, like the kinds academic researchers write, are typically long, text-based, highly detailed documents, which makes them less-than-ideal for communicating your findings with busy stakeholders.
In the context of UX research, the report you share outside your research team will likely be closer to a summary: a shorter, top-level document with a greater emphasis on next steps and business application than on methodology.
Synthesizing and sharing your findings is only one half of the communication equation. The recipients of that information also need to listen and remember.
Tailoring the format of your research summary can help your audience process and retain the information more effectively. Common formats include:
Written reports work well for when you’re speaking to small groups, a geographically distributed team or technical stakeholders like engineers or other researchers.
They’re also great for when you need to keep a comprehensive account of the study on record; some researchers always create them for the research repository.
Written reports may take the form of:
However, many researchers complain that stakeholders don’t read them or are overwhelmed by the sheer volume of information.
Presentations work well for when you’re speaking to large audiences, especially when meeting synchronously (although recorded presentations can be effective too).
Presentations may take the form of:
According to our previous the State of User Research Report, most researchers (87%) still share their results synchronously, despite being fully remote. This is likely due to the more engaging nature of live presentations for non-technical stakeholders, designers, or visual thinkers. They force you to be precise and focus on only the most important information.

Although each has its pros and cons, we recommend doing both! Creating both a detailed report and a presentation ensures that different types of audiences can access and appreciate your findings in the future.
When it comes to capturing (and keeping) stakeholders’ interest, workshops are a great option.
Research workshops are group exercises designed to make the information more “sticky” or memorable for stakeholders. By sharing an overview of your key findings and then leading a workshop—for example, a group brainstorming session or card sorting activity based on the study’s findings—you can collect feedback from stakeholders and keep them engaged throughout the presentation.
As Product Designer Lucy Denton says in an episode of our Awkward Silences podcast, workshops can also be an effective choice when you aren’t sure what next steps to take based on the insights:
“I think some of us had some gut feels around which ideas made sense for us to investigate further. But we couldn't really articulate that…. So we decided to pause on the ideas and get a few of us in a room and run a product strategy workshop. And in that session, we looked at competitors in the market and thought about our current product and where we wanted to grow. And we didn't really come up with anything new in that workshop, but it was a useful exercise to sit down and all get on the same page and document that and play it back to the team so that we were all aligned.
And then it was easier to come back to the ideas and say, well, which of these ideas are going to help us grow in the ways that we want to grow. And we landed on three big ideas, and that has been our focus for 2021.”
Research reports can take many forms, usually aligning with the type of study you conducted. Usability studies, for example, will require a usability report, while competitive analyses will result in a competitive analysis report, and so on.
Here are some of the most common types of research reports:
You may also pair your report with other types of research deliverables, such as personas or customer journey maps, but these deliverables are meant to augment—not replace—the report.
As UX Researcher Katrya Hott notes, the most impactful type of report depends on the maturity of your research organization:

“Good” is a bit of a loaded term, no matter the context—so before we provide examples of “good” research reports, let’s break down what that actually means.
While the format and content will vary, good research reports all share four fundamental qualities. They are:
Like the proverbial unwitnessed tree falling in the woods, the report that nobody reads never makes a sound. Want to make an impact as a researcher? Your reports need to capture stakeholders’ attention.
Whether your report is shared synchronously or asynchronously, you can spark engagement by including:
If you master the art of engaging stakeholders, you might notice reports being shared and referenced more often, as well as a growing demand for research throughout your organization. Highly engaging reports almost evangelize themselves.
Actionable reports should relate back to the initial research question: How do your findings influence the decisions you mapped out in your research plan?
When stakeholders finish digesting your report, they should have a clear understanding of what actions they need to take based on the insights. As you’re writing, be specific about the insights you’ve discovered and the tangible implications they have on the company.
For example, “users are unhappy” is not an actionable insight. Although this might be a true observation from your study, it’s not specific enough about the context or application of the insight. You could rephrase “users are unhappy” to be a more actionable insight in the following ways:
In other words, actionable reports provide:
Although you should be objective and unbiased while conducting and analyzing research, know that it’s okay to offer your opinion after the research is done. As the researcher who led the project from start to finish, you’re in the best position to interpret the data and make recommendations for how it should be used.
By tailoring your report to fit the communication style and the areas of interest for your audience, you increase the chances of them listening, remembering, and referencing your findings later on.
When creating your report, ask yourself:
Finally, good reports should be easy to access and understand.
If your reports are engaging, actionable, and effectively tailored to the audience, then they’re already in a good position to be easily understood. But in order to be easily accessible, they need to be housed somewhere stakeholders can (and will) access.
The common industry format (CIF) for a usability report provides universal guidelines for the research community, helping folks read reports more efficiently. If your audience is other researchers (who also read and write this type of report regularly), then the CIF format works great (and although it’s only intended for usability tests, you can draw from a similar rough outline when writing reports for other types of studies).
However, this format tends to be quite lengthy, making it less-than-ideal for sharing with stakeholders. You’ll want to take a similar structure and condense or reorganize it in such a way that stakeholders can quickly, easily glean the information that’s relevant to them.
In the next section, you’ll find some inspiration for doing so—using condensed versions of written reports, interactive research repositories using tools like Notion, or visual presentations.
Looking for inspiration for your next report? Here are some resources to reference:
Now that you know what a research report is and what a good one looks like, how is a research report written?
The basic outline of a research report is:
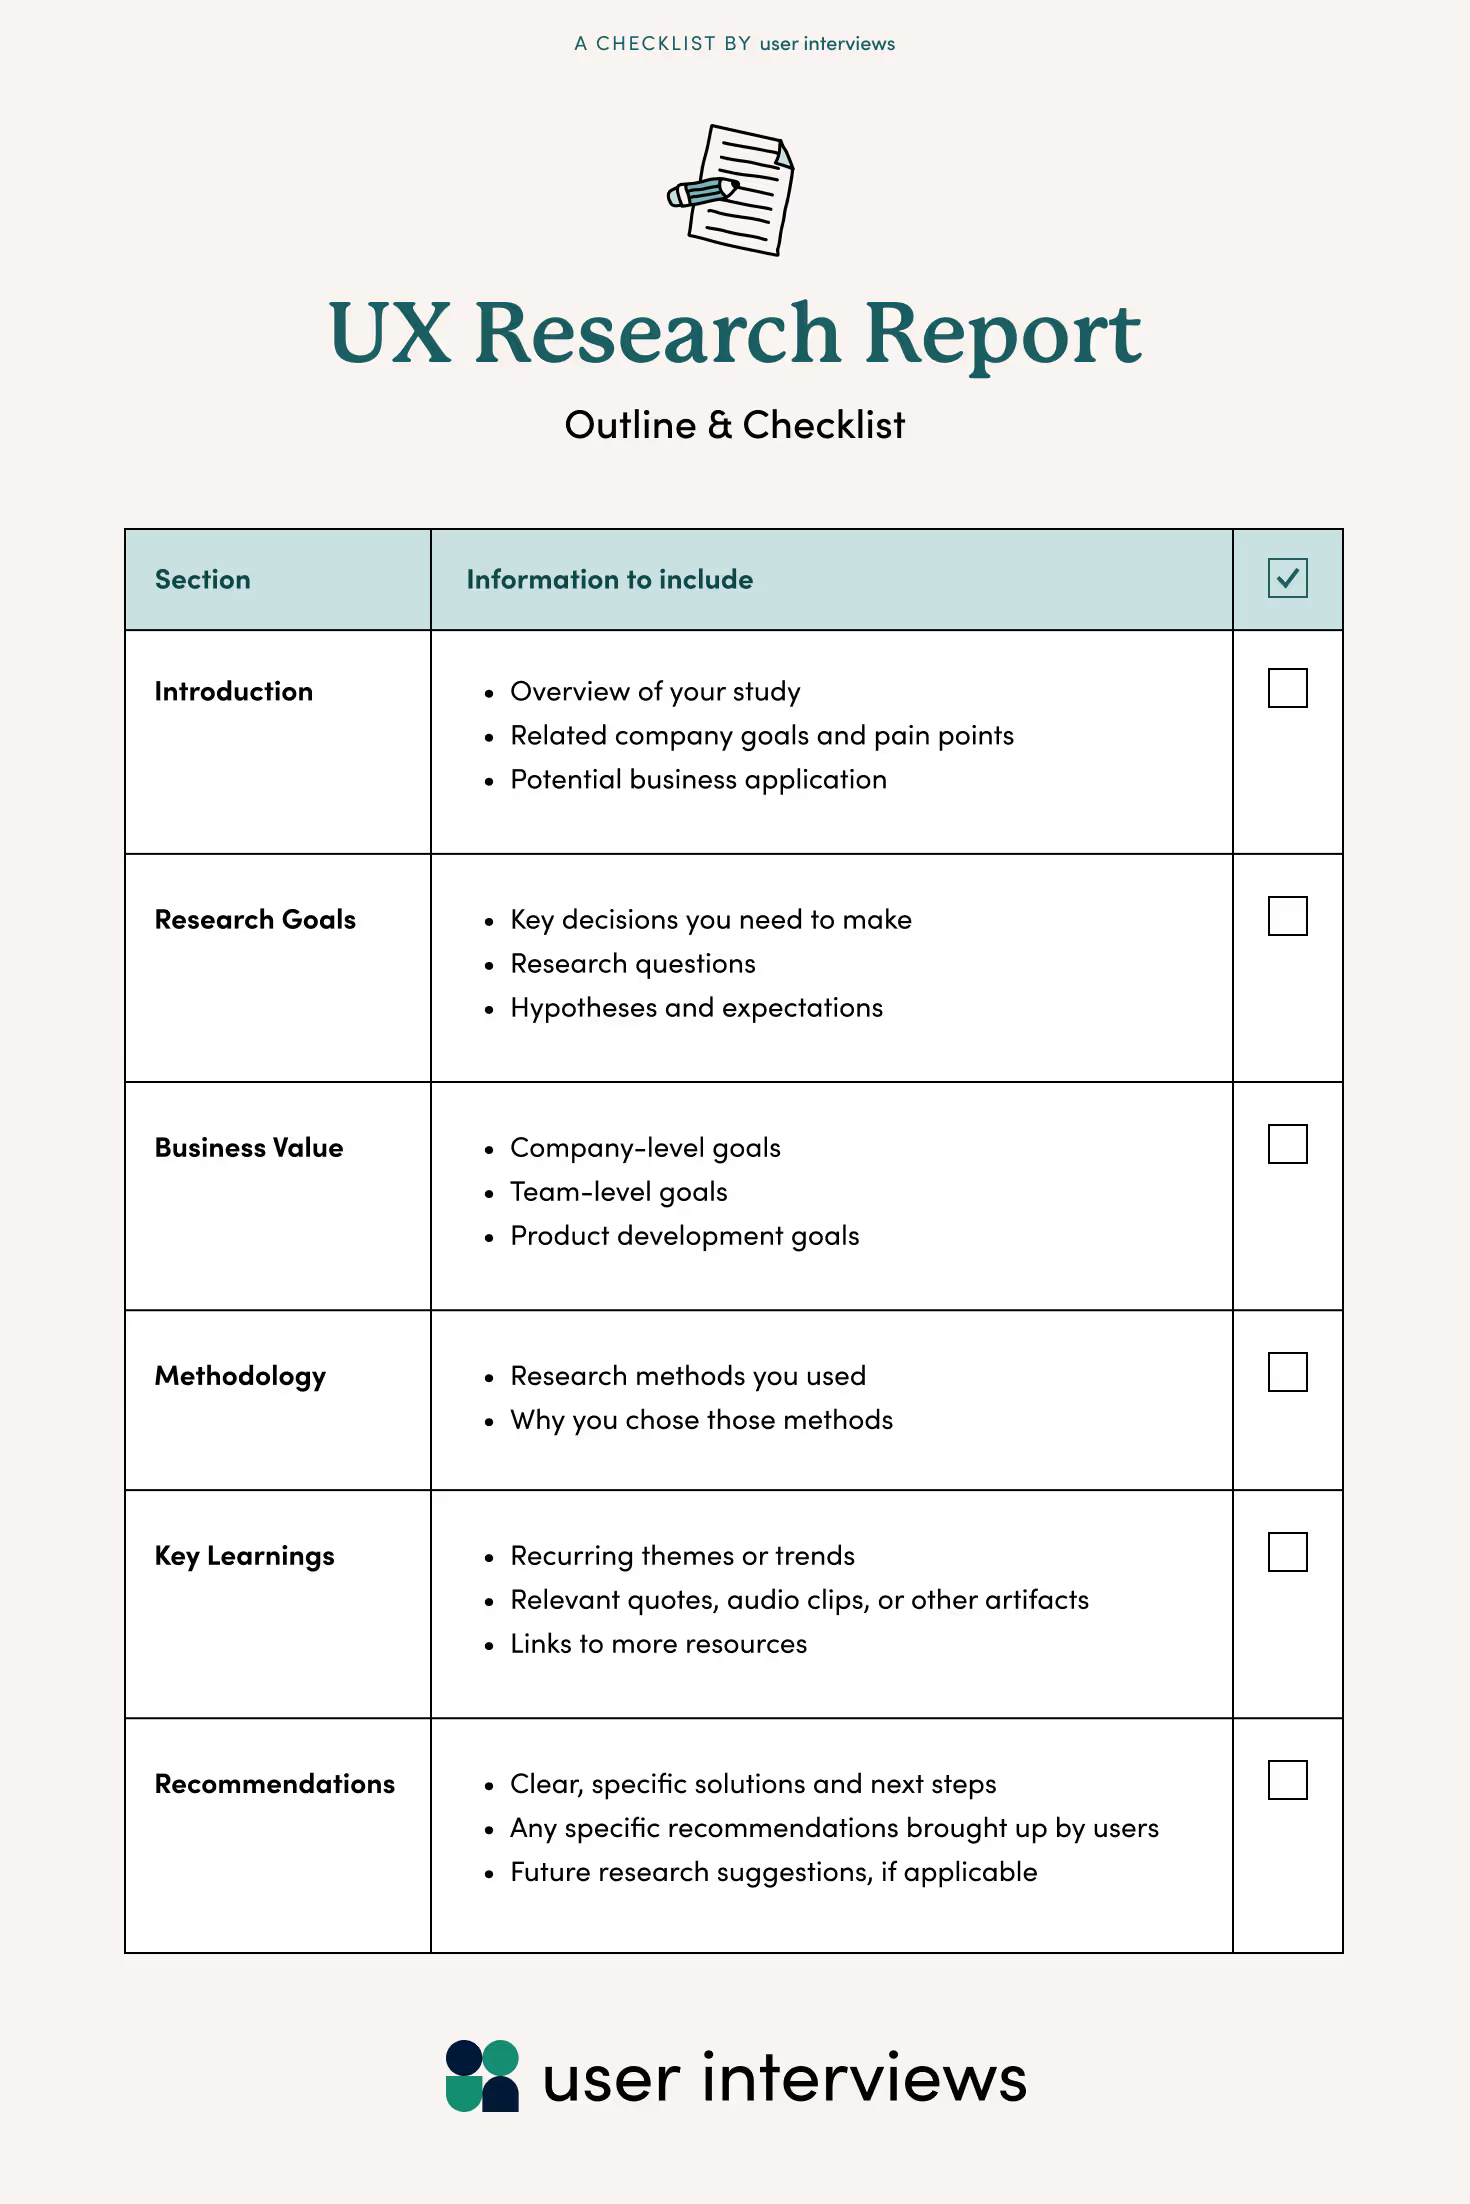
Here are some tips for each section.
Beginnings matter. The introduction of your report is your opportunity to set the stage for your audience, to capture their attention and convince them that the information you’re about to share is valuable.
Next, you’ll need to outline your specific research goals and questions for the study. Luckily, you mapped this out ahead of time in your UX research plan, so you might be able to get away with a bit of copy-and-pasting in this section.
Great UX researchers are always mindful of the business implications of their work—and they make sure stakeholders understand those implications too. In this section, delineate how your research impacts top-line business metrics and overall growth goals.
Although you’ve carefully evaluated and chosen your research methodology during the planning process, your stakeholders likely don’t need to hear all the thinking that went into that decision. Explain your approach in clear language, tailored so that non-researcher stakeholders can understand.
The learnings section is the “meat” of your report—the insights and observations that make your research worthwhile. Present your findings as clearly, concisely, and with as much context as possible to help stakeholders make sense of the data.
Finally, the recommendations section makes up the “actionable” part of your report. Based on the insights you observed, share potential solutions or answers to the questions your research was meant to investigate.
When you finish creating your report, you don’t just tuck it away in a Google Drive folder and never mention it again—you have to let stakeholders know, firstly, that it exists, and secondly, why it’s valuable.
Here’s how to present research findings.
At this point, you’ll have already conducted stakeholder interviews during the planning process to learn more about their needs and goals. Based on those interviews, you should have a good understanding of what they’ll expect from your presentation, including:
Marketers and product managers, for example, will have different needs and expectations regarding the research you’ve done. Do your best to tailor your presentation to each different group of stakeholders—but also provide people with multiple formats and ways to interact with your report just in case.
At the beginning of your presentation, remind yourself and your audience why you did this research. What were your learning goals? How will you use the information? Which decisions will it inform?
Goals are, of course, something you’ve been continuously referencing throughout your study. Their value is probably clear by now: By tying your research to top-level goals and objectives, you leave stakeholders no room to doubt the importance of your work.
You’ve carefully chosen your methods to support your learning goals. Here’s your chance to show stakeholders how (and why) you approached the study this way.
Explain (as concisely as possible):
The format you choose will have a big impact on whether or not your stakeholders understand the information and how much of it they remember.
In most cases, your stakeholders won’t have the time or expertise to digest sheets of raw data. Although it’s great to provide and archive the raw data to show your work, your stakeholders will often only need and want a summary of key insights, translated into a format that they’ll find relevant, actionable, and easy to understand.
As for the ‘best’ format, it’s the one your stakeholders will actually use.
No matter which format you use—a slide deck, a diagram, a theatrically-performed monologue—it’s great to use storytelling arcs and elements to keep your audience engaged.
Storytelling is communication that moves people. That’s why we cry while watching The Florida Project on the flight back from a work conference, or laugh when we remember the name of that whimsical book from our childhood.
To incorporate storytelling into your presentation, consider structuring your narrative like Joseph Campbell’s Hero’s Journey:
If you’re curious about using storytelling structures for UX research presentations, you might enjoy:
As you conducted your study, you might’ve collected research artifacts in the form of:
Include these artifacts where relevant (and when allowed, given the privacy and consent terms of your study) in your presentation to help illustrate your findings more clearly.
This is the section of your presentation where you can add the most value to your stakeholders—and likely where they’ll be paying the most attention.
Based on the data you’ve presented, provide clear, specific, data-backed recommendations for moving forward, including future research if needed.
To make it as easy as possible for stakeholders to understand your recommendations, you may want to explicitly write out the teams (and/or team members), takeaways, and actions, like in the example below.

In the example above, the researcher has recommended next steps for the Product and Marketing teams to improve the current onboarding experience for users, while acknowledging that additional research is needed to reveal specific pain points and areas for improvement.
Before you tackle your next presentation, why not check out some examples to make sure you’re on the right track?
Here are some sample presentations to draw inspiration from:
Nothing’s more disheartening than working hard on a study and discovering compelling insights, only to have stakeholders ignore or overlook those findings.
Save yourself the disappointment by presenting engaging, actionable reports to stakeholders.
Your work matters—and it deserves to be seen.

Schedule your demo and see us in action today.


