From AI hype to LinkedIn posts about layoffs, it can seem like UX research is sending a distress signal.
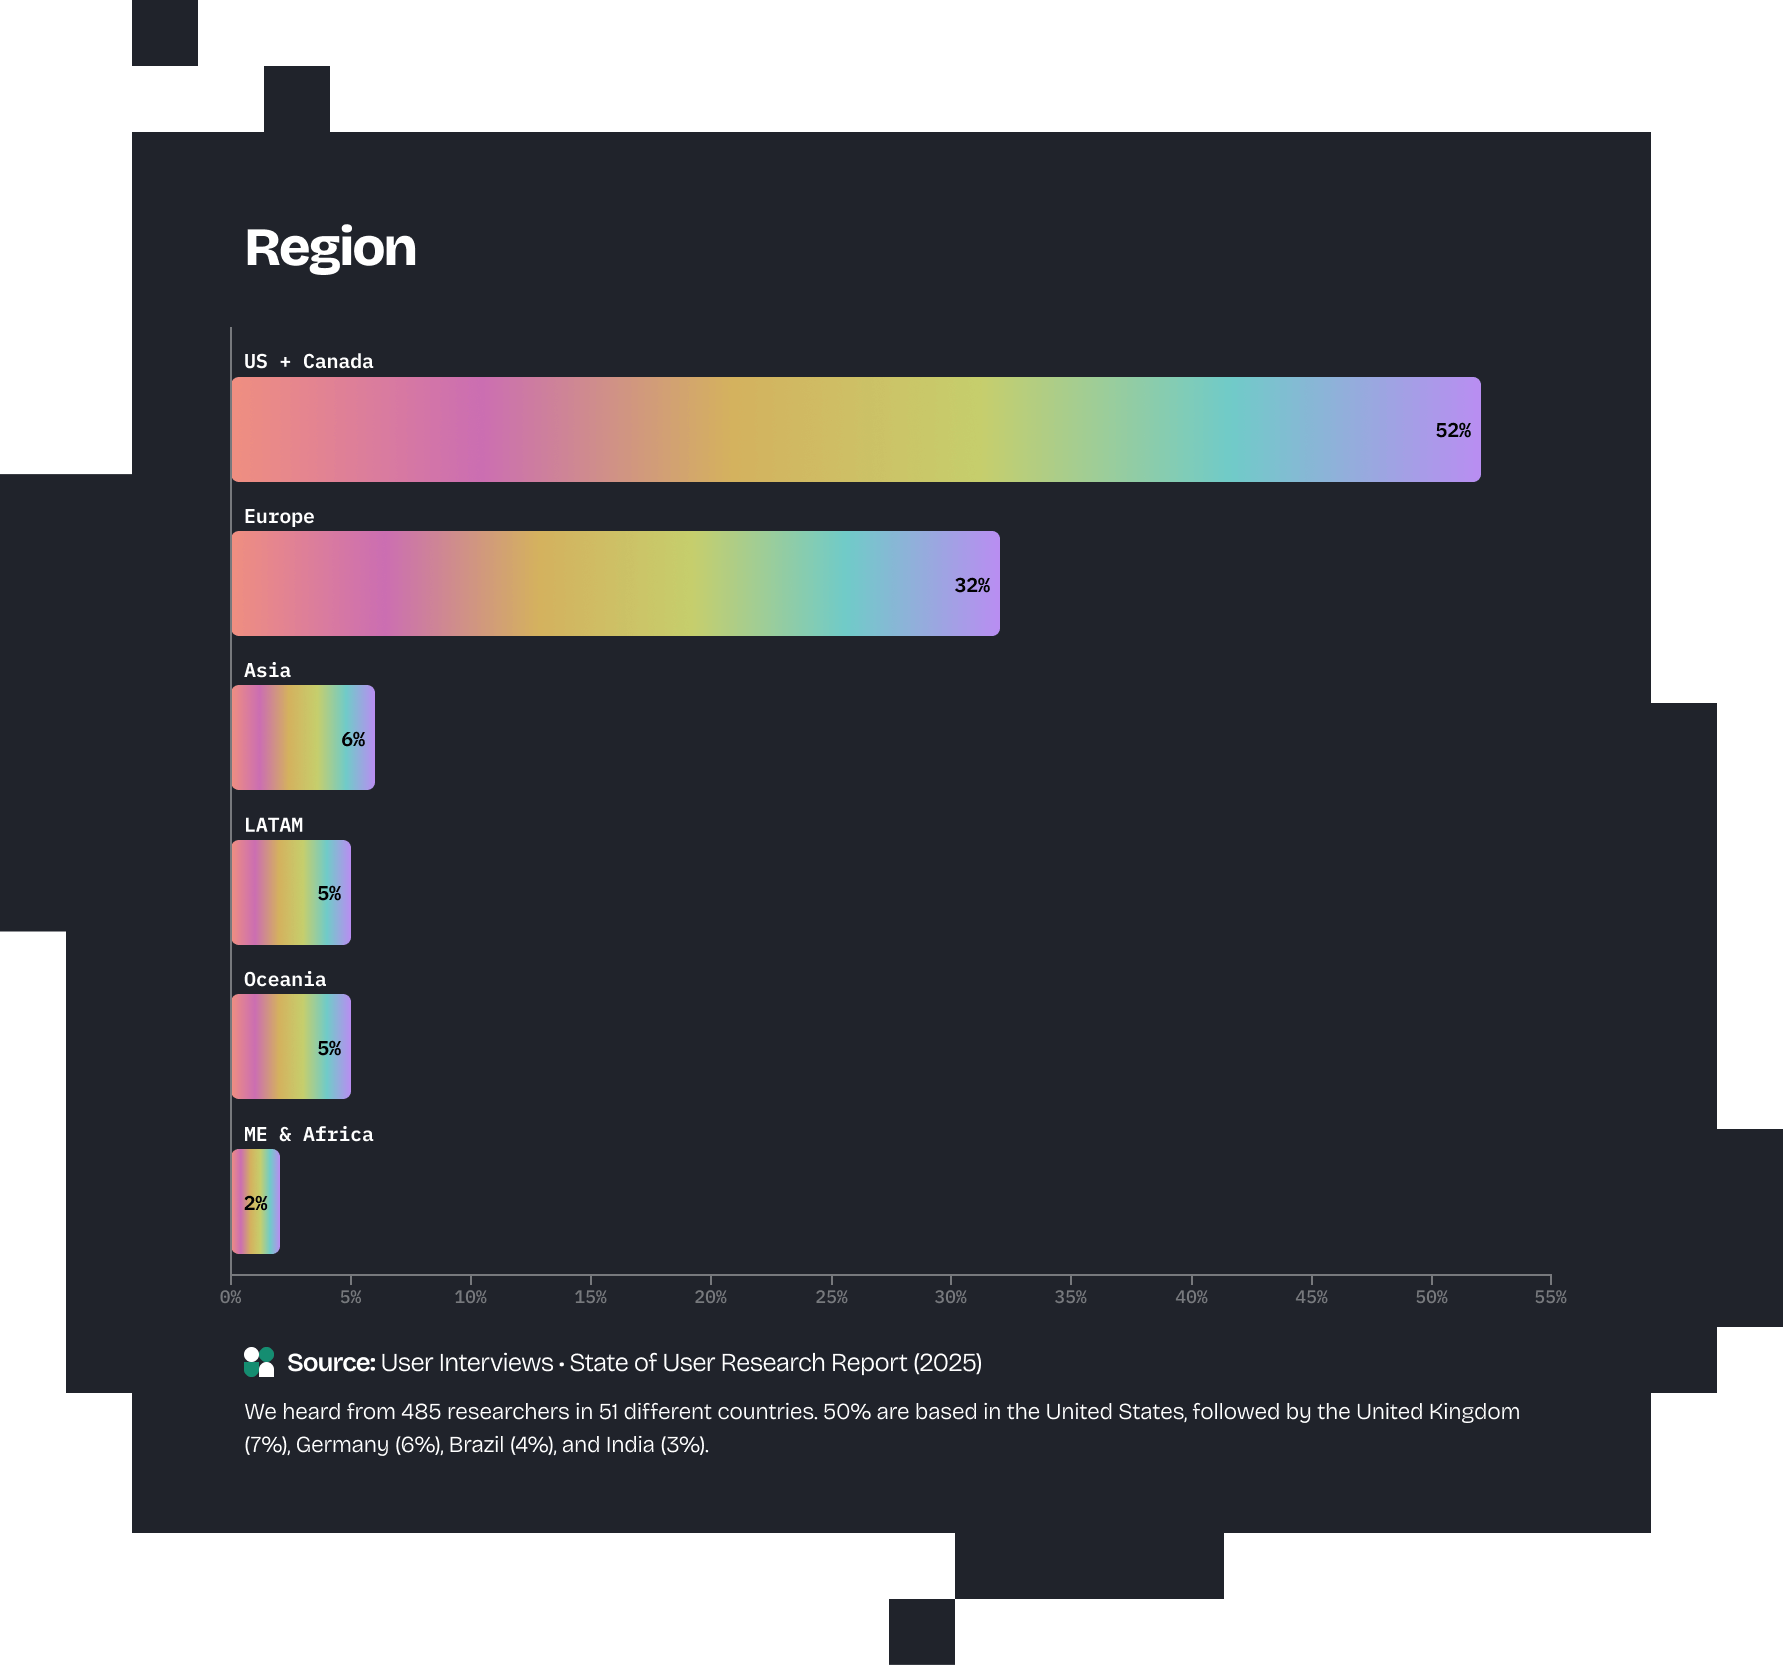
But when we surveyed 485 researchers across the globe about their research identity, craft, strategy, salary, tools, and support, the data suggested a different trajectory: User Research isn’t in free fall. In fact, it’s cruising at altitude.
The past five years have seen no shortage of dramatic change, but of the 300+ data points analyzed, only ~20% showed statistically significant changes year over year.
We’re not saying the ride is perfectly smooth, either: Of those differences, the biggest shifts were in researcher sentiments or habits—like their feelings about the industry or AI, or the methods they used to achieve research goals.
This is how we’re seeing it: Turbulence is just part of staying airborne—and most researchers are finding many ways to make it through the wild ride.
So dive in below as we answer some of the most pressing questions in research—and stay tuned as we go deeper into the data in our series of follow-up reports! We also asked user research and ReOps experts to help us parse through the latest findings and themes during our 2025 State of User Research webinar. Sign up to see their insights.
Possibly. Within our sample, many of the trends in the day-to-day workings of user research—headcount, employment, team sizes, and completed projects—stayed consistent. However, some movements around the margins suggest signs of change that our data can’t fully capture.

Our sample size shrank 36% from 2024, meaning some voices may be missing this year due to layoffs, but timing likely played a role, too — the survey ran for two weeks in late July/August, a popular vacation period. The longer survey length may have also deterred completions.
Feedback also indicated that out-of-work UXRs didn’t have a clear path to completing the survey, so this edition may read more as a State of [Employed] User Research.
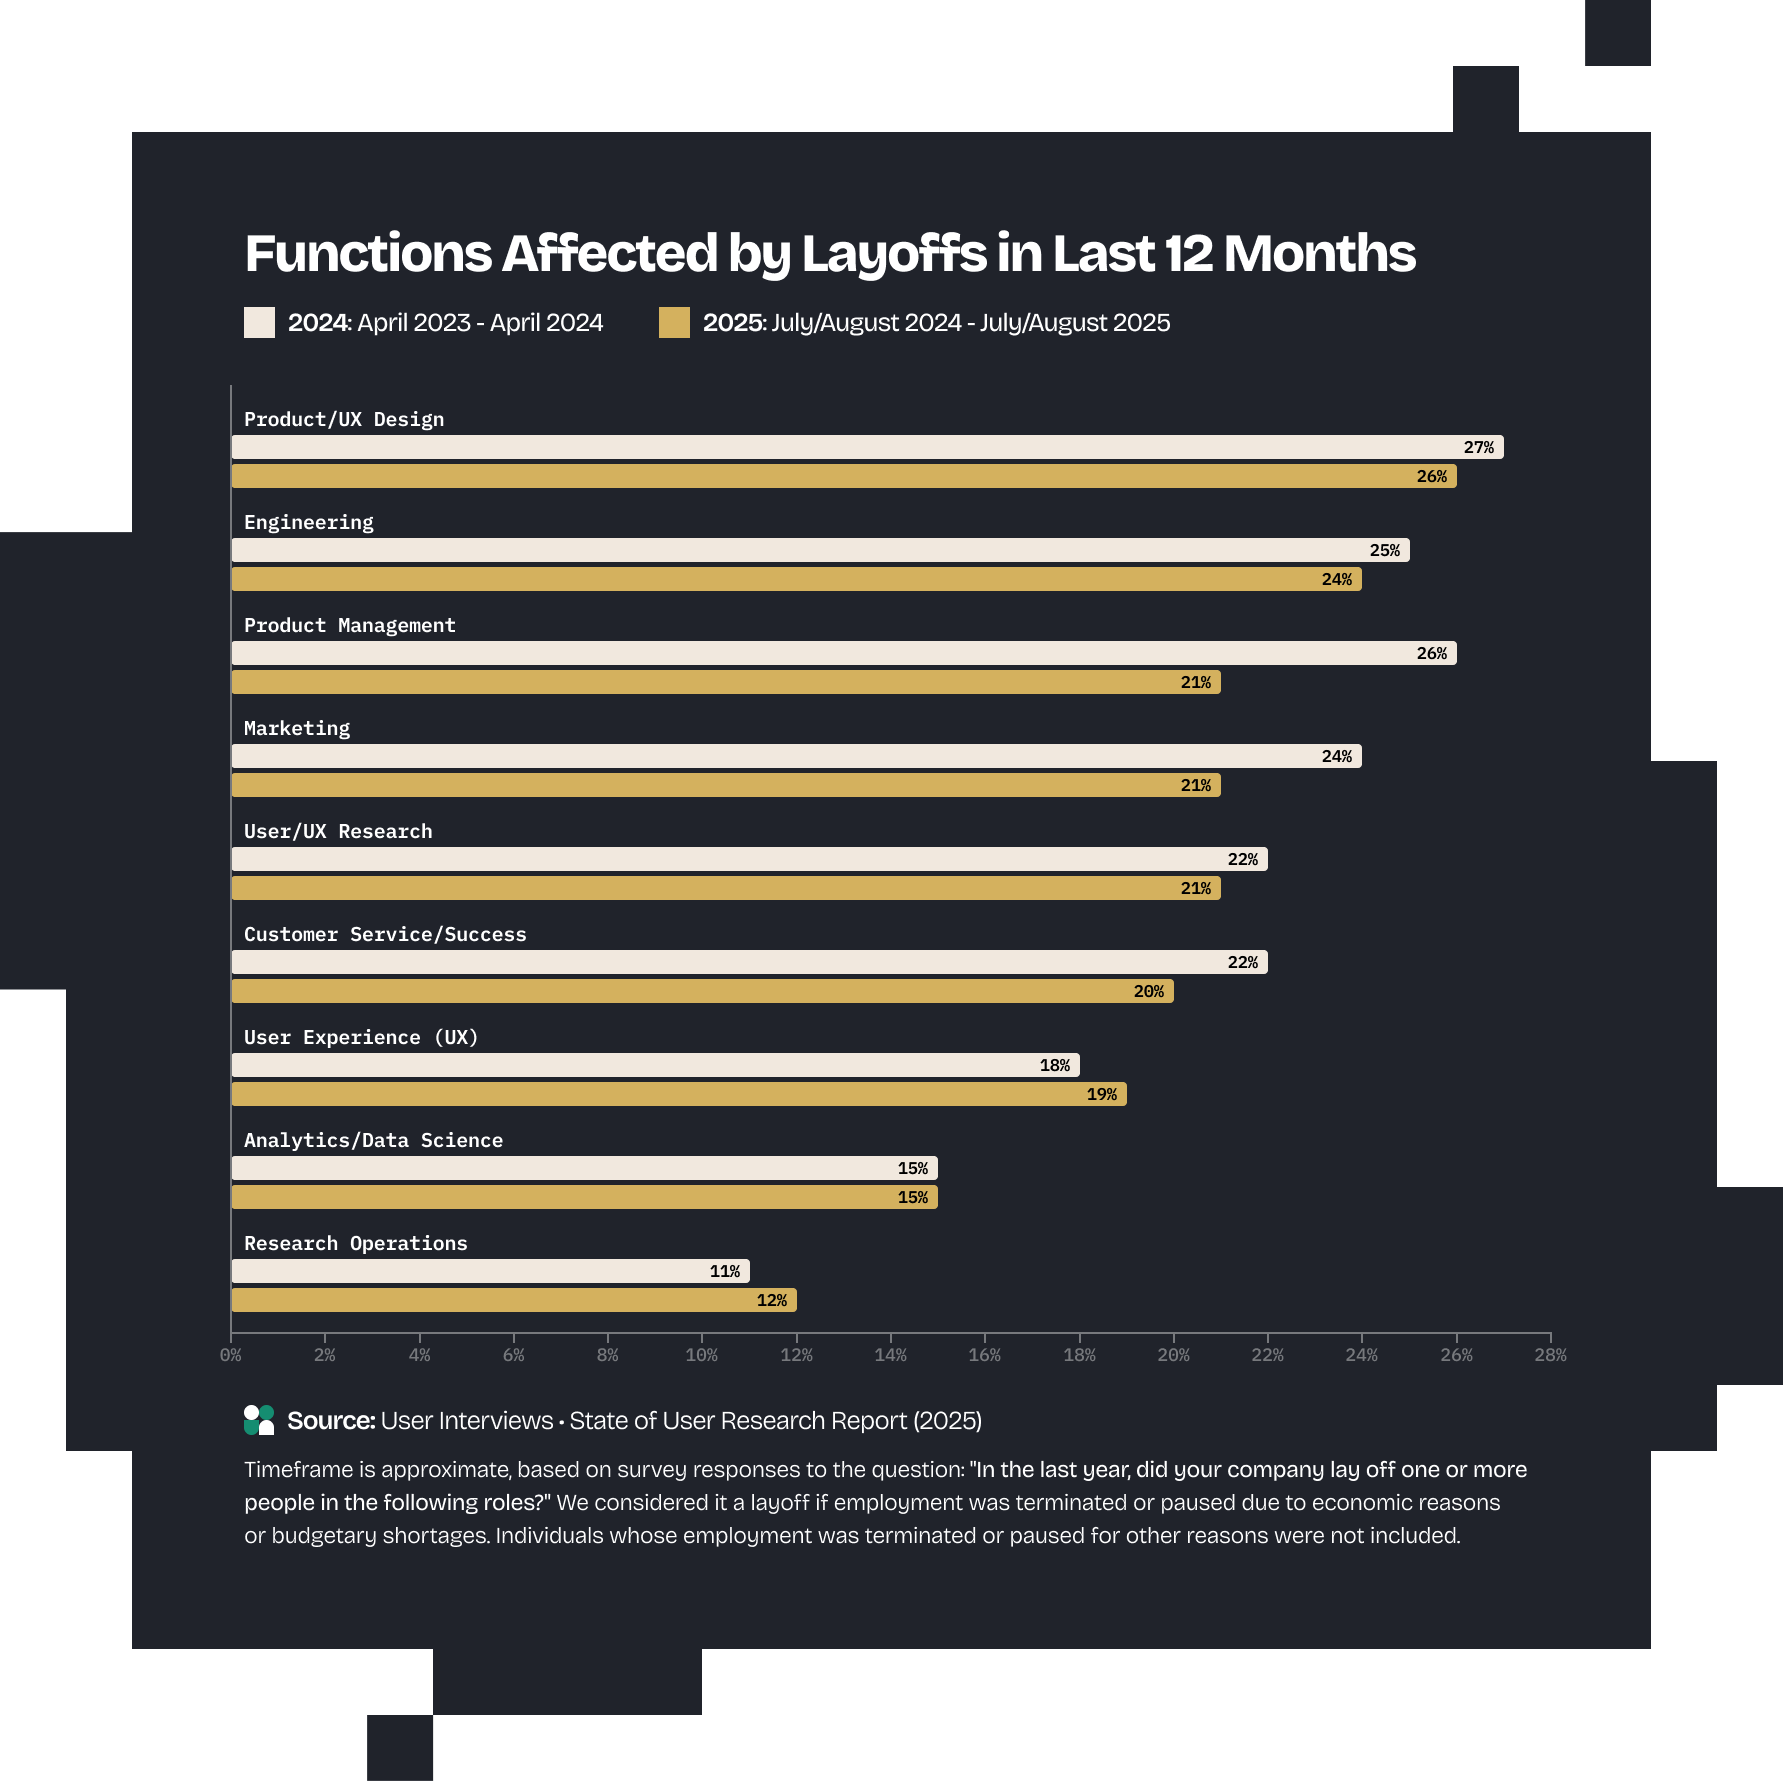
In 2025, 21% of respondents said their companies laid off user/UX researchers—roughly in line with 2024. This year, 11% of respondents reported being laid off.
“I love my job and would love to stay at my current company for a long time. However, it’s hard to enjoy my work when the discipline is being reduced across tech companies and there’s a constant fear of being in line for layoffs. I enjoy being a researcher, but if I don’t see myself in this role 10 years from now, it’s unfortunately because of the direction the industry is heading. Then again… is there really any ‘safe’ role at the moment?”
While those numbers might seem high, data shows UXRs were not disproportionately affected: the average prevalence of layoffs by department was 20%, with UXRs slightly below Product/UX Design (26%), Engineering (24%), and Product Management (21%).
“There is very little opportunity for entry and mid level UXRs in FTE roles. I’ve spent countless hours going to workshops and having conversations with other UXRs to fill the gaps in knowledge [...] How am I supposed to grow and learn if I’m not provided opportunities to?”
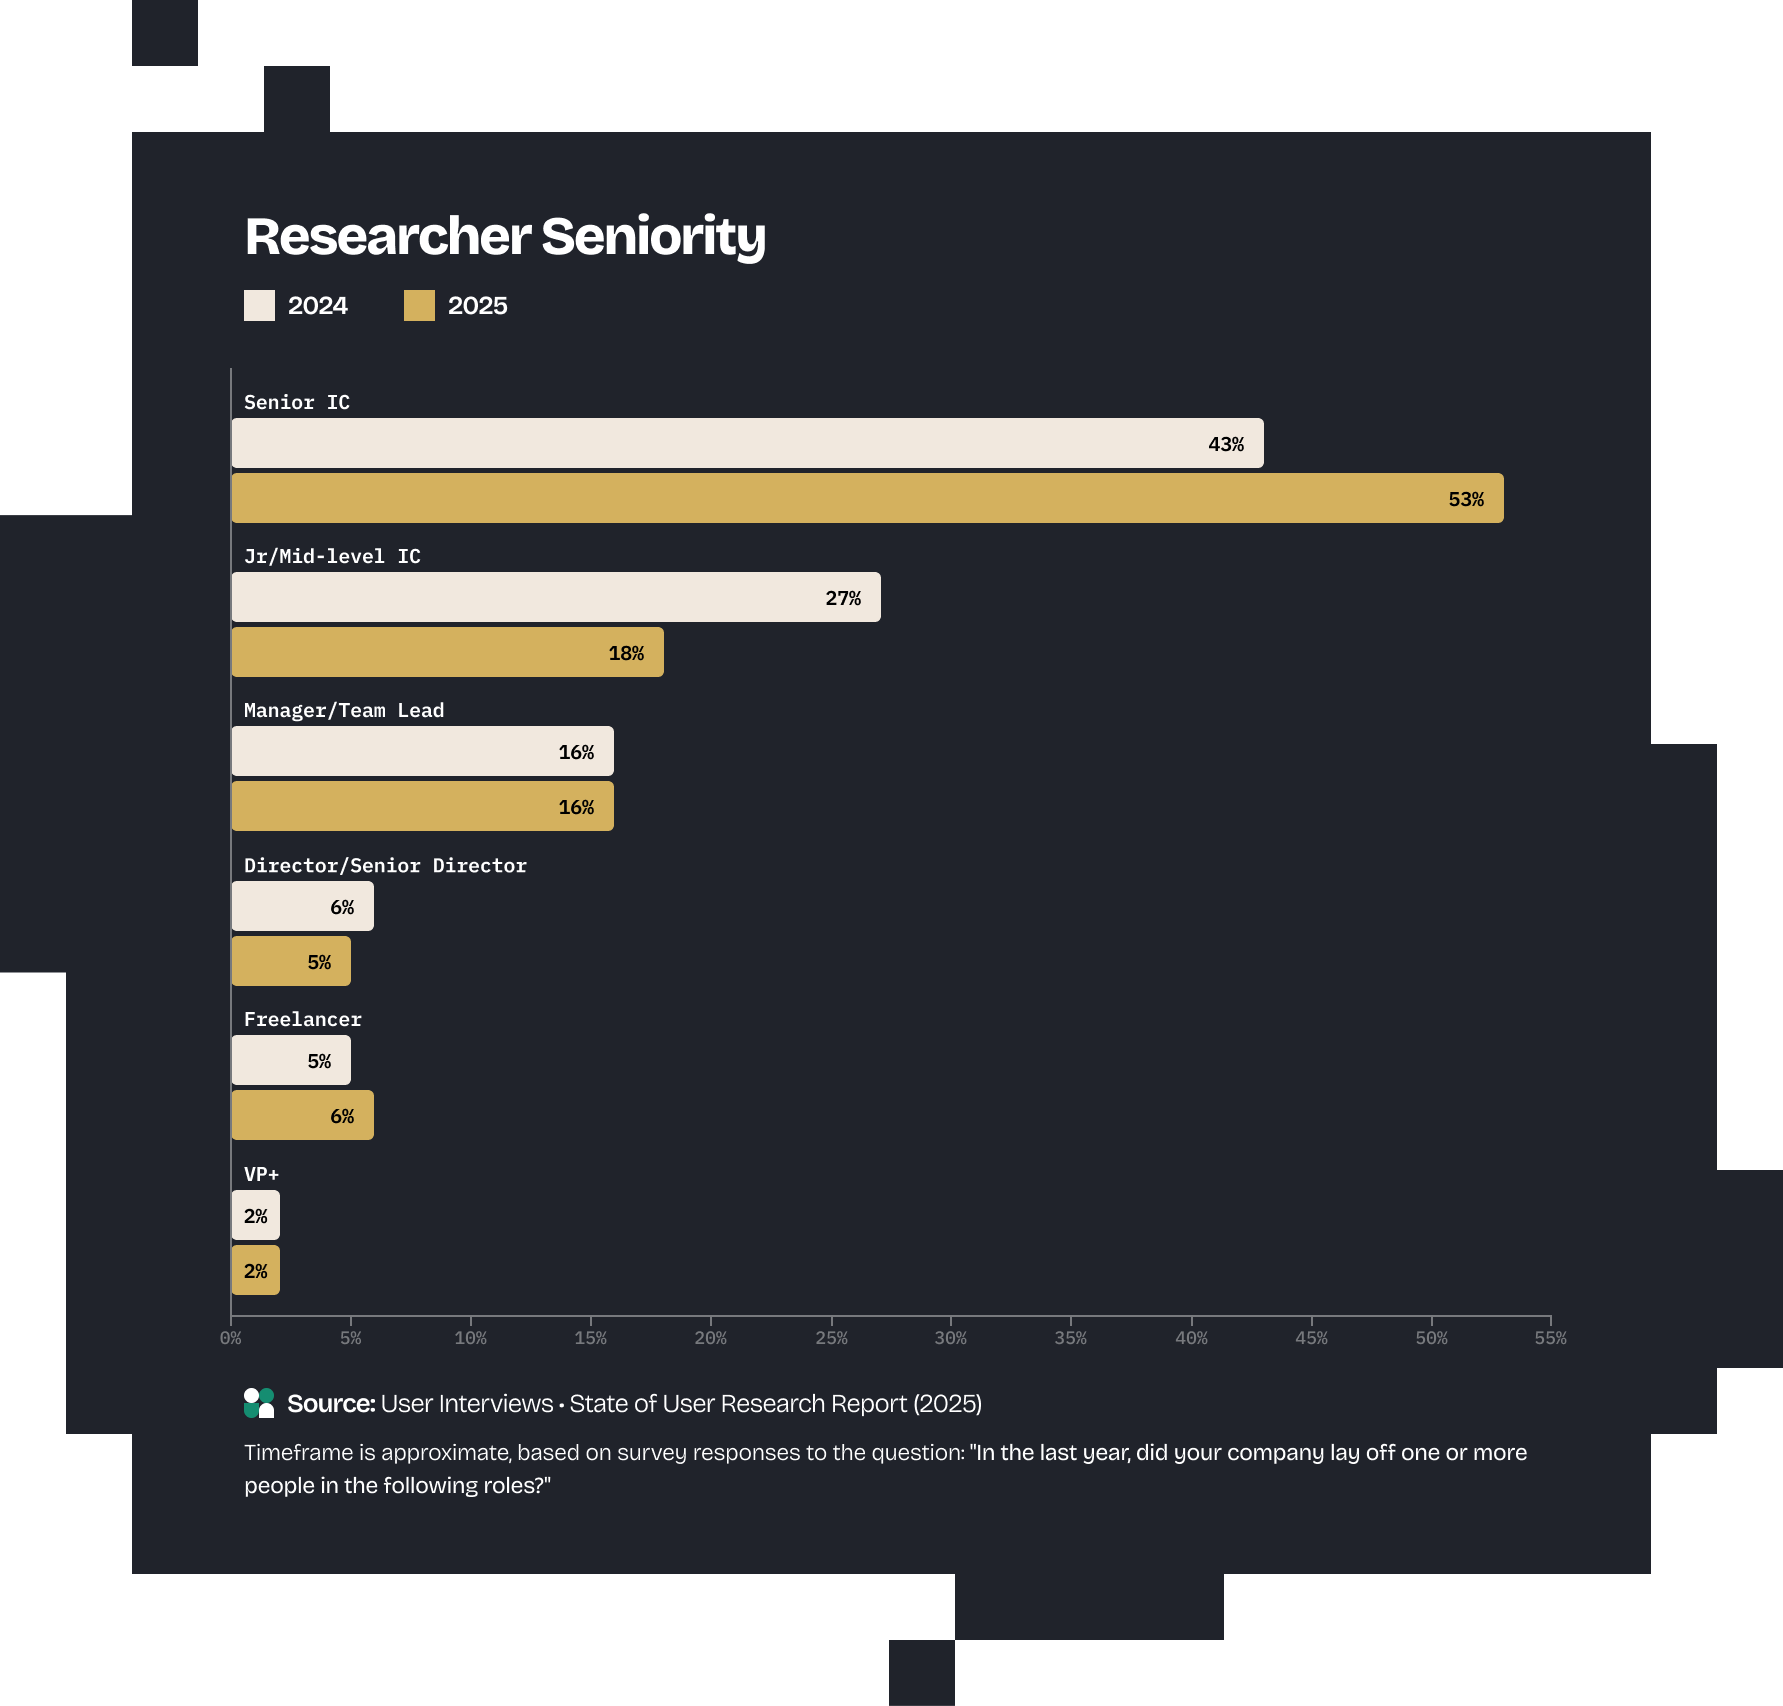
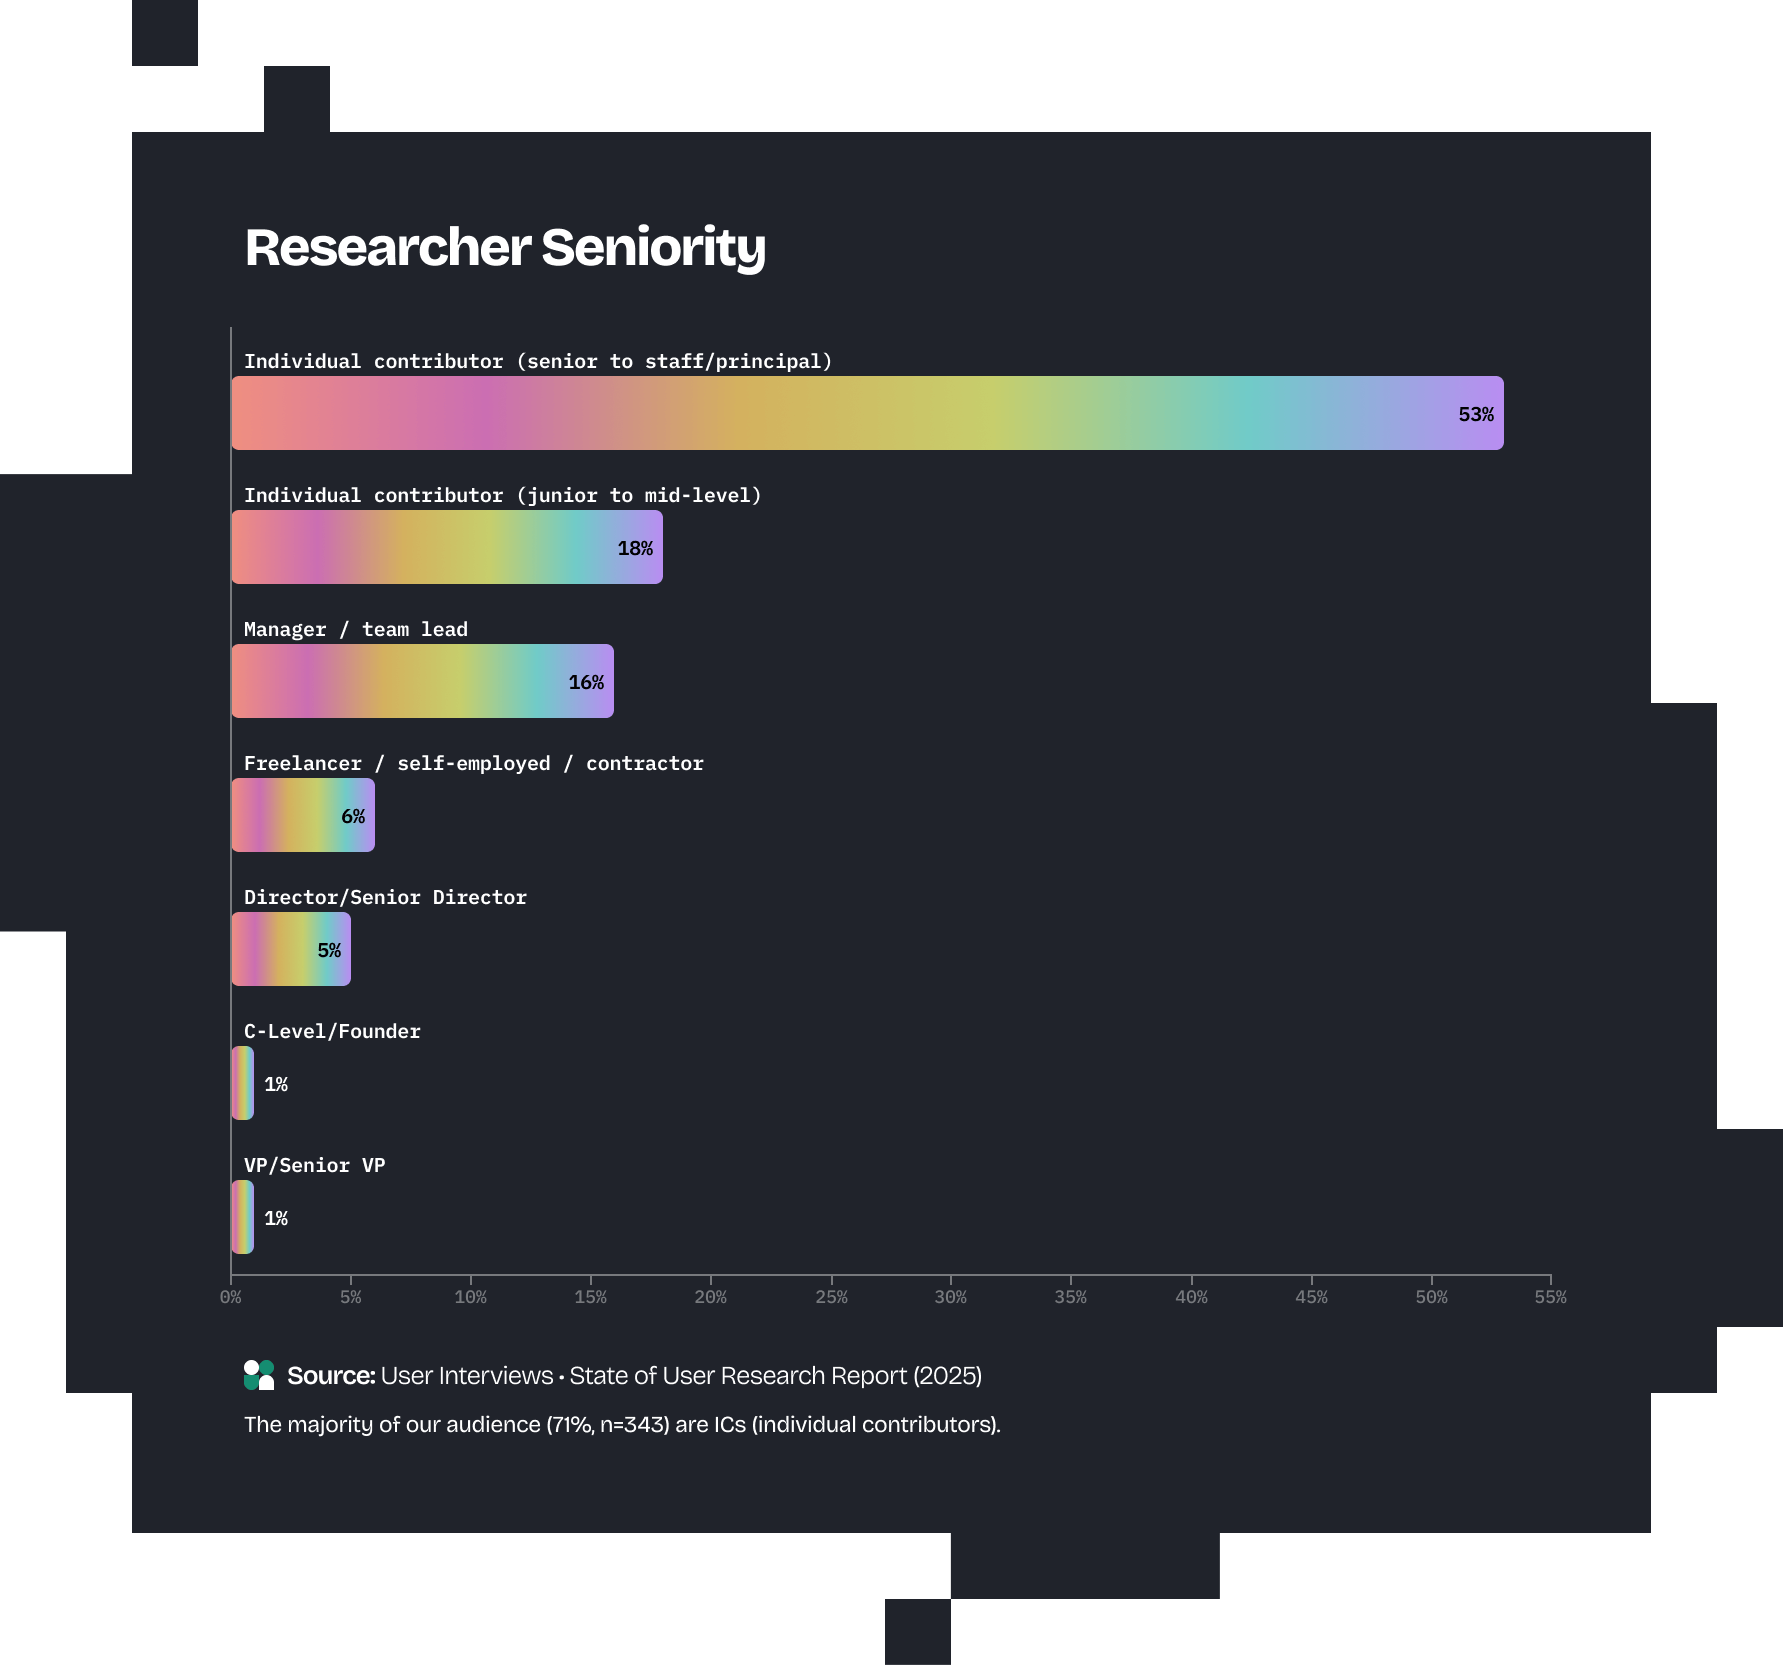
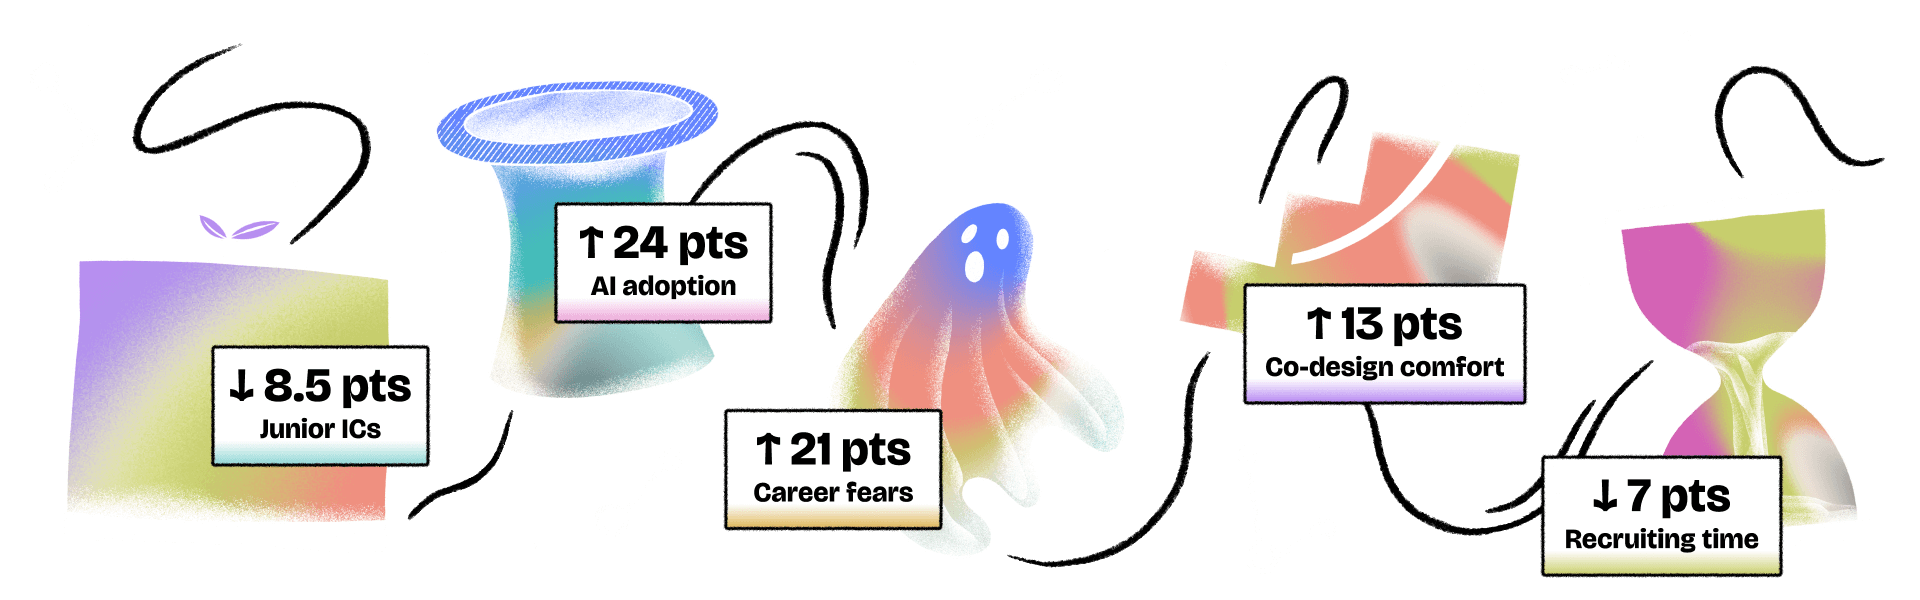
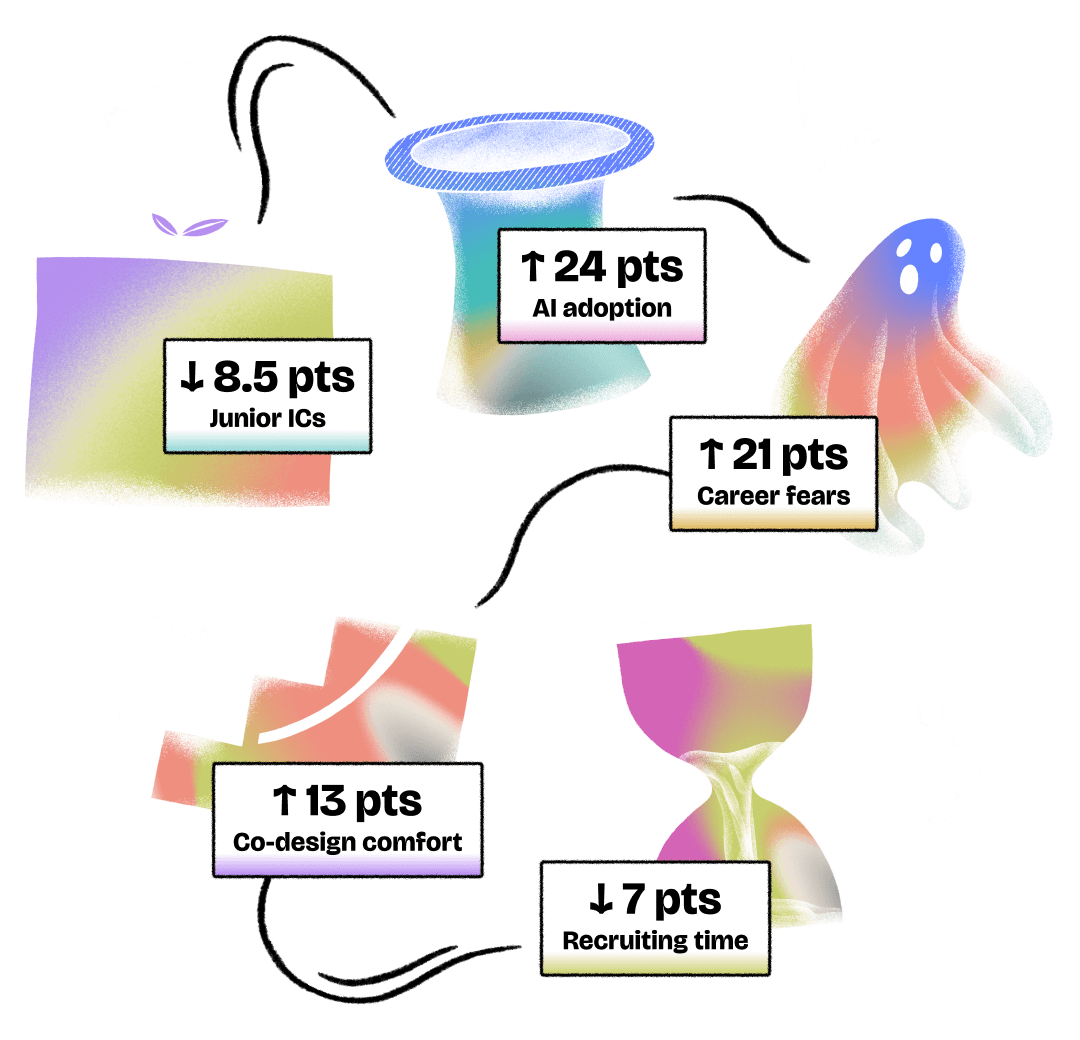
There were fewer junior voices in this year’s sample (down 8.5 percentage points from 2024). At the same time, senior to staff/principal ICs now comprise more than half of responses—nearly a 10-point increase.
Is the aforementioned rise of AI to blame? While we don’t have any data from our survey about the relationship between AI and the availability of roles in relation to seniority, other studies have pointed to a decrease in entry-level roles for this reason.
Drill Bit Labs noted in 2023 that much of the tech workforce expanded quickly during COVID and then adjusted as growth stabilized.
In the State of User Research 2019, 19% of UXRs said that their company had zero dedicated UXRs. In 2022, that number was just 6%. For 2025, that number is nearly 14%—higher than 2022’s low for sure, but still trending lower than in 2019.
“I believe that the near term will be pretty rocky, but the opportunities and shifts that AI is pointing towards are ultimately going to be very, very positive for people involved with what we now call “UX” in the long run. But only if we exercise extreme agency and stand in our own strength and power. I predict a decline in the power of Product Management and Engineering over time.”
With precarious economic conditions, democratization, and advancements in technology, UX research still finds itself in a period of transition.
From what we can see within our sample, the field is largely adapting to make space for these changes while still championing the power of rigorous research.
As history shows, there’s always been a real need to create products that serve both the business and its users.
It’s important to remember that User Research is still a relatively young profession for most teams/companies. About half of the teams we surveyed were fewer than five years old.
While we can’t predict the future, we’re optimistic that the field will continue to adapt and evolve.
To see more significant fluctuations in the sample, check out our sample and methodology.

To put it lightly, researchers are feeling a bit of motion sickness—democratization, layoffs, and AI have dominated the headlines—all making for a fairly bumpy ride.
Almost half of researchers (49%) we surveyed said they feel bad vibes about the future of UXR—a 26-point increase from 2024. Career opportunities? Even worse: 67% gave a thumbs down—up 21 points from last year.
But here’s the plot twist: They’re riding all of it out without losing altitude—or momentum. They’re poking at new methods, hacking workflows, trying out AI tools, and sharing insights in inventive ways.


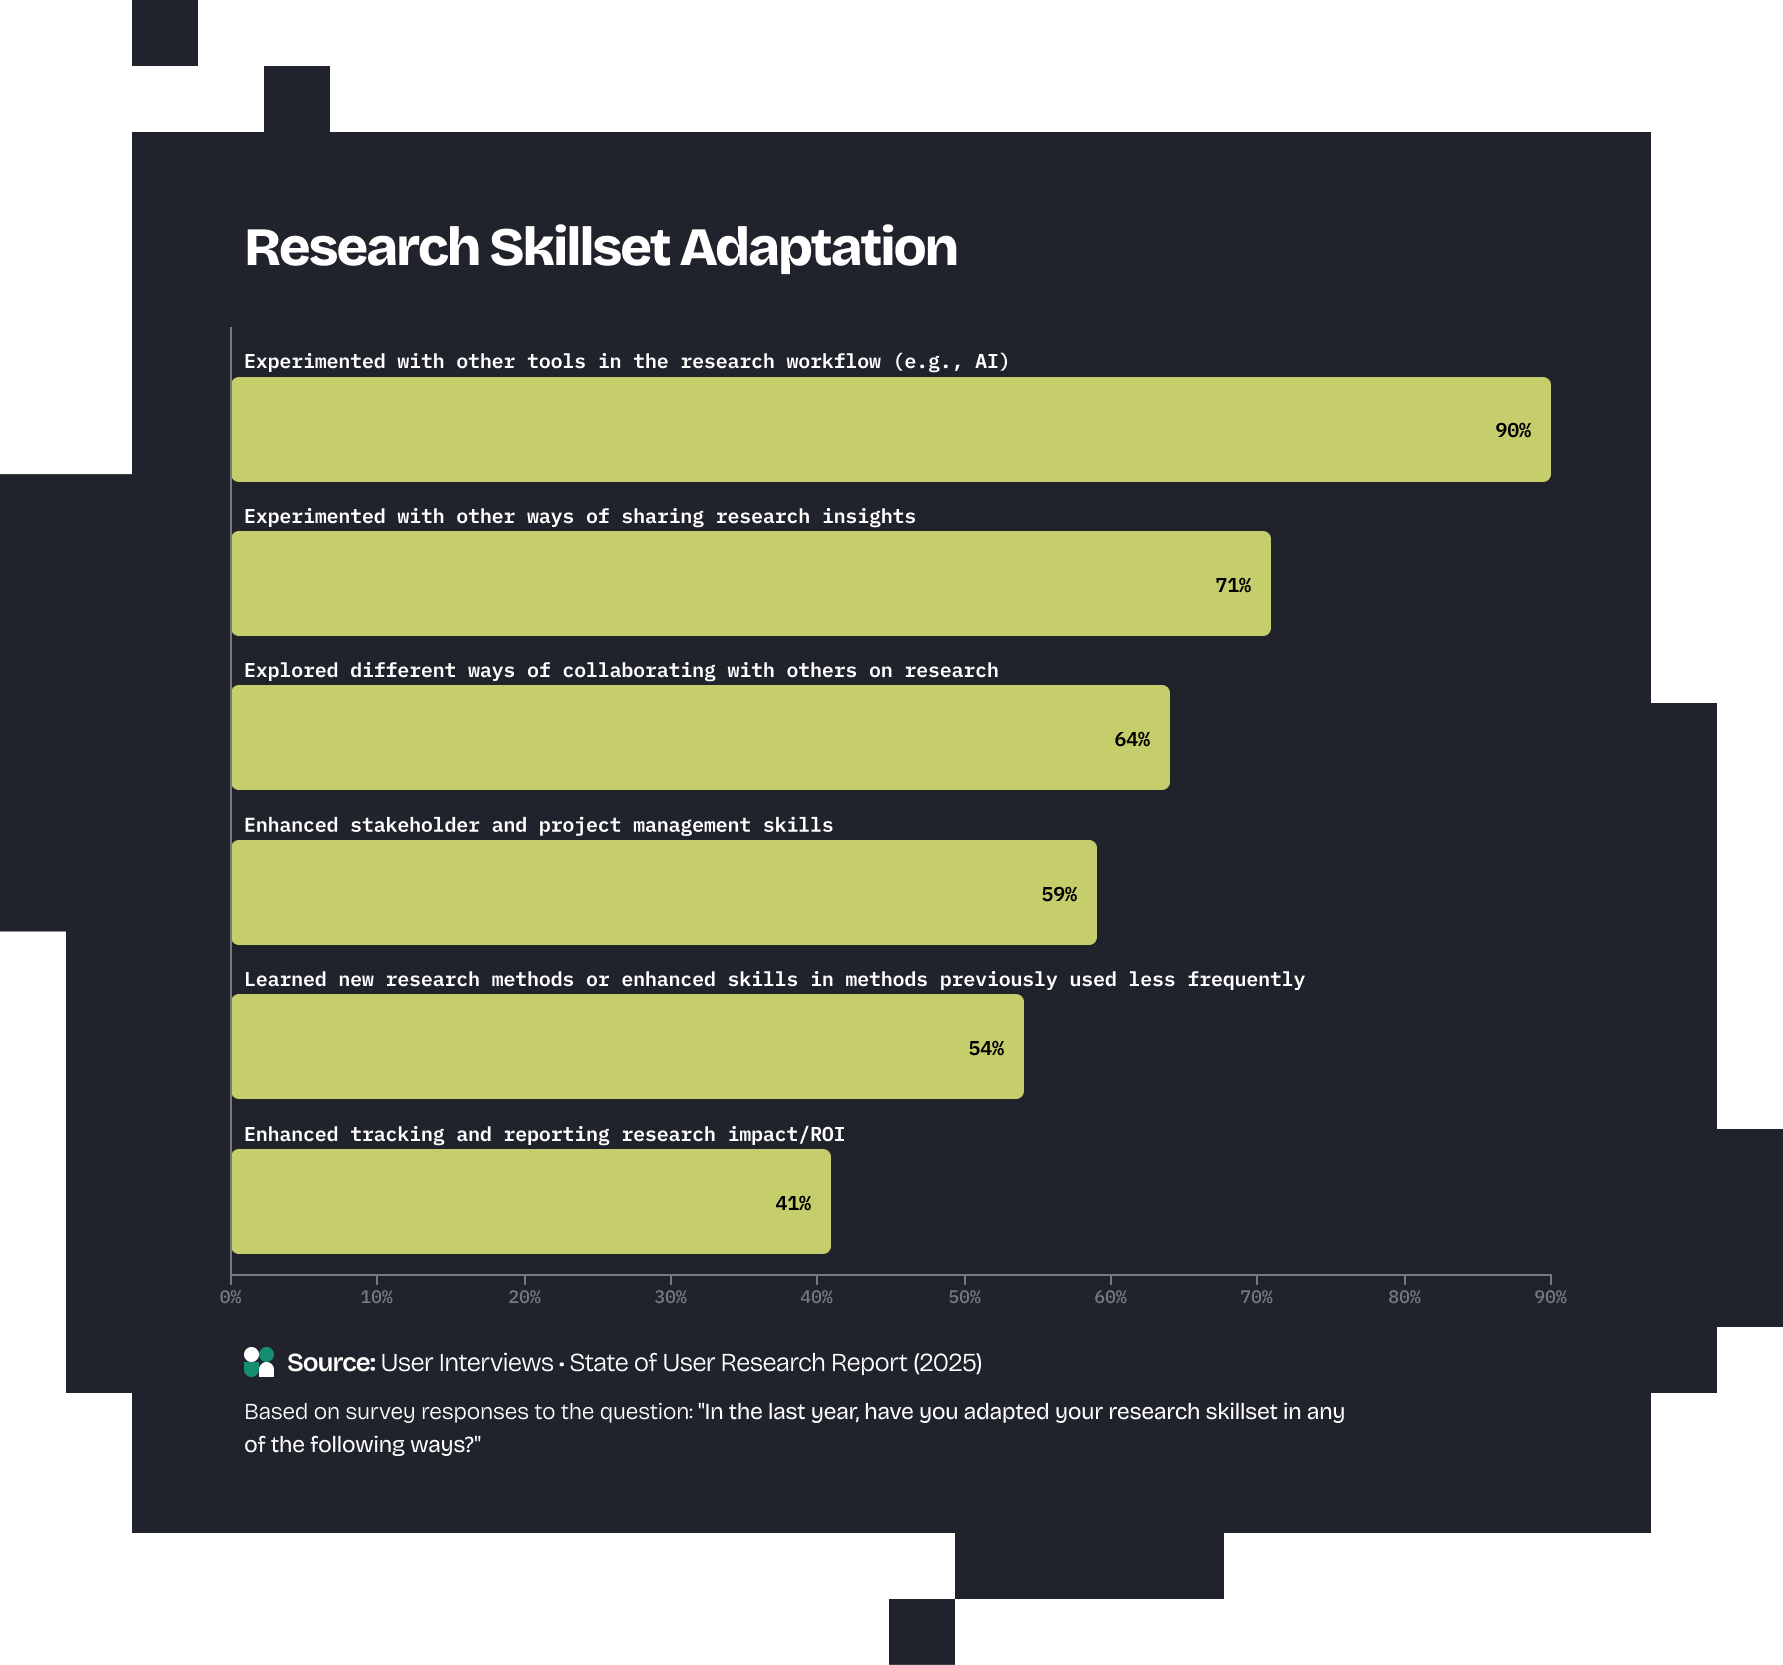
In 2025, the most common ways respondents grew their capabilities included experimentation: with tools in their research workflow (90%), ways of sharing research insights (71%), and collaborating with others on research (64%).
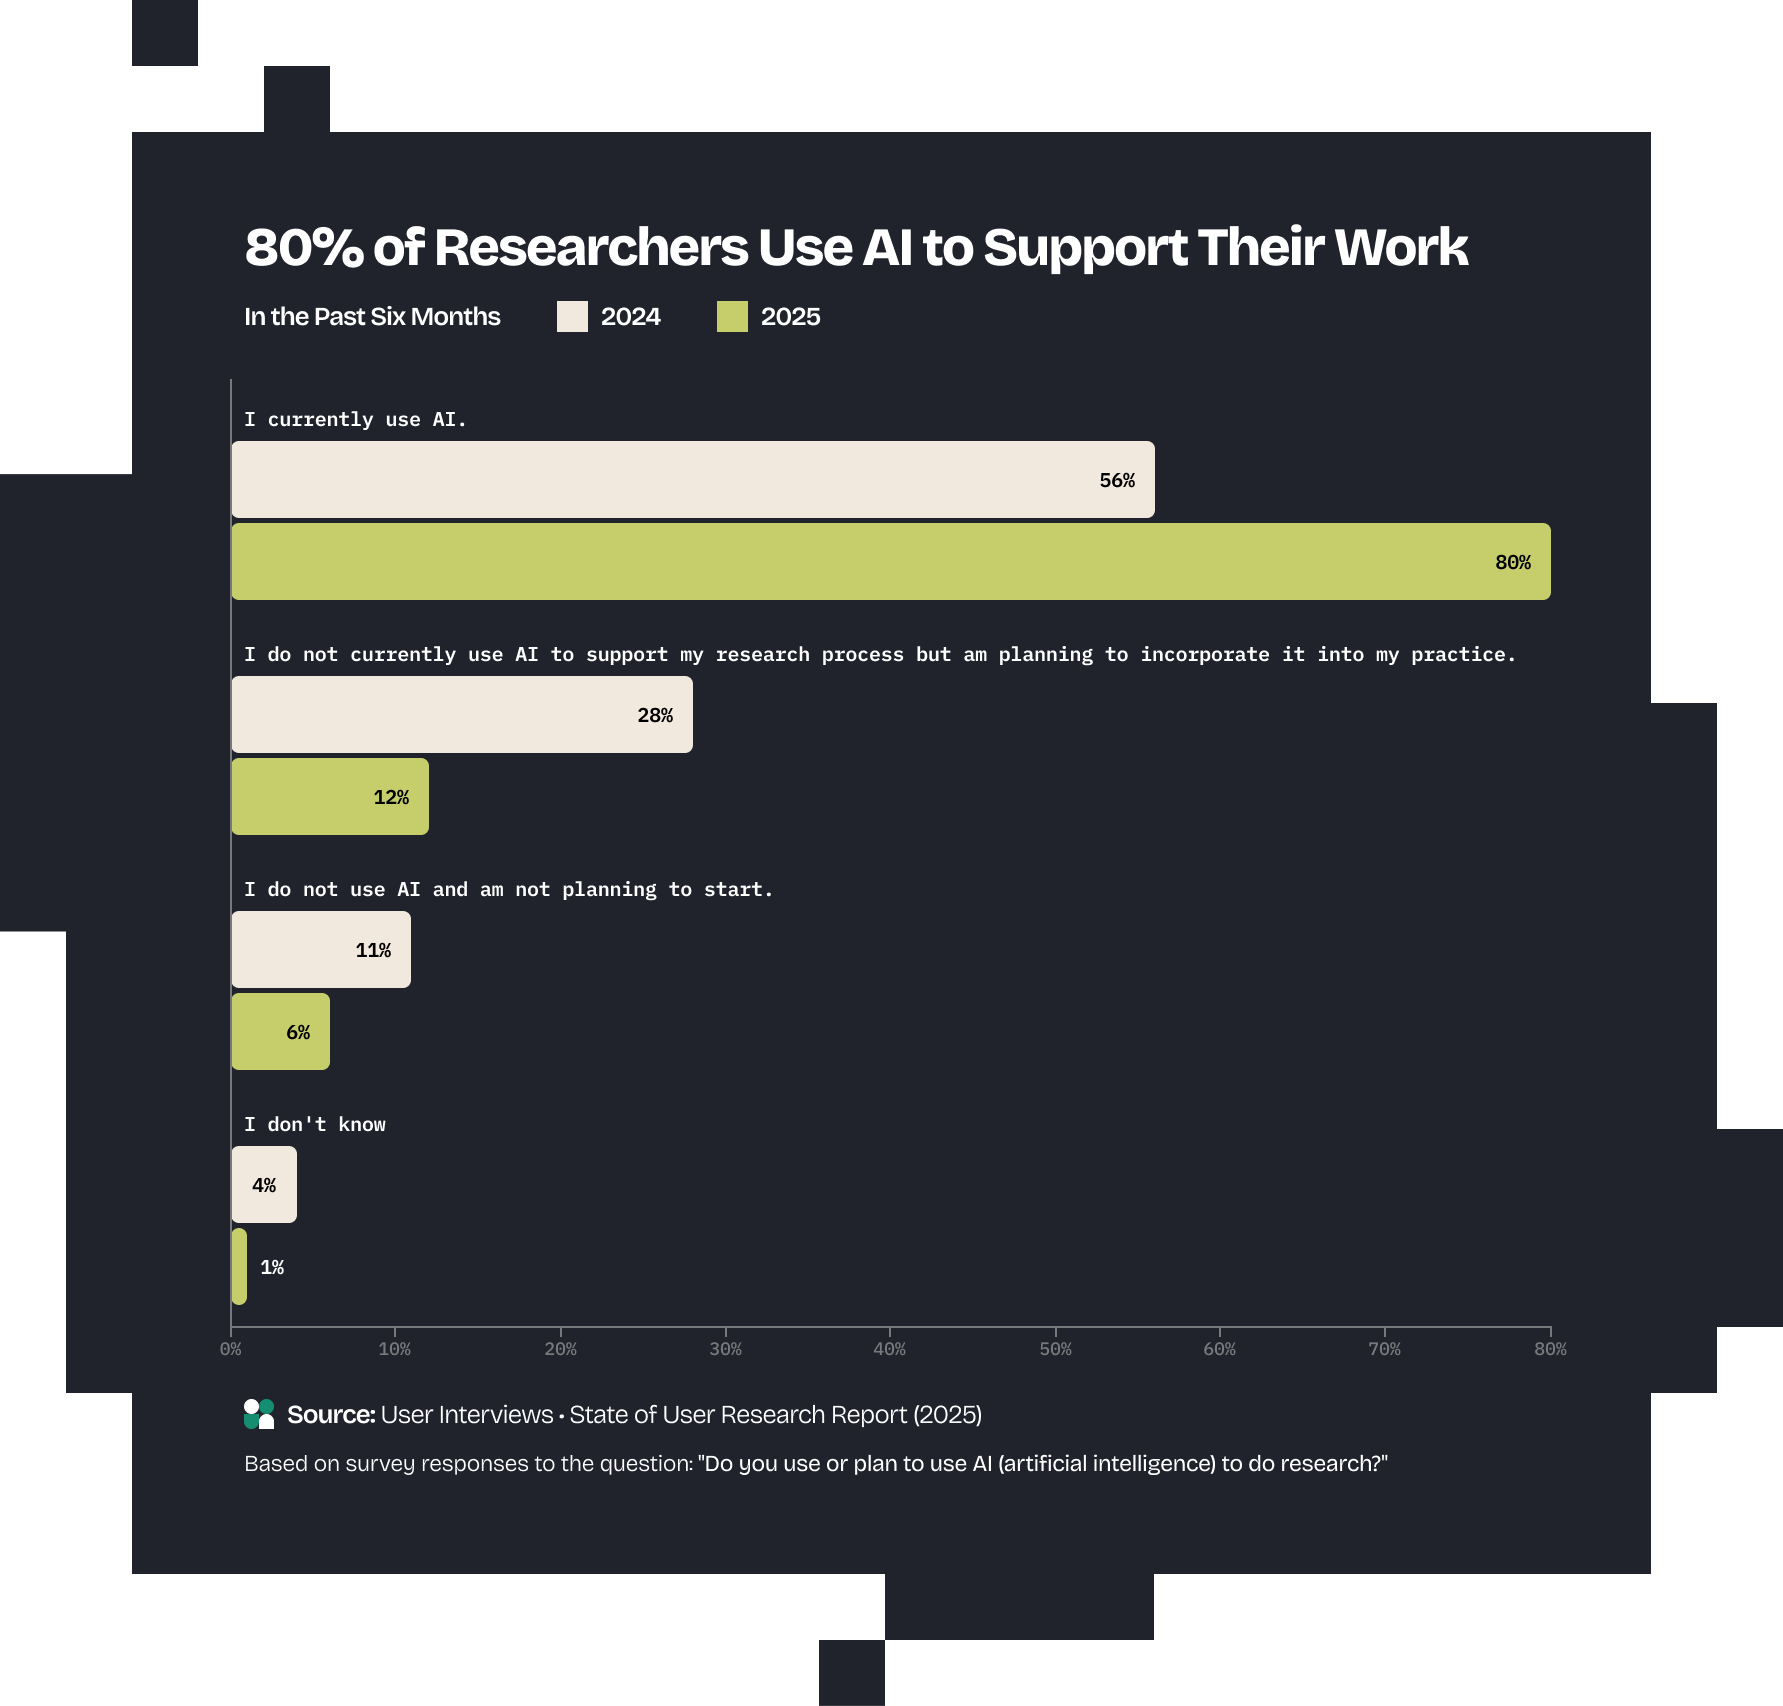
A significant portion of this adaptation involves AI. The number of researchers using AI skyrocketed 24 points year over year, reaching 80%.
AI is also becoming a day-to-day aid. When seeking answers, 78% still turn to Google, but asking an AI chatbot has jumped to the second most popular approach (67%), a 22-point increase from 2024.
"AI is becoming a focus over bigger customer problems in a way I don’t love, and although it helps with lower lift tasks, I feel pressured to use it or else I’ll be left behind. It speeds up my work but at the cost of my retention and sanity and quality of output. I fear I’m losing my voice the more I use AI, but I have to use it out of necessity to get things done at the pace I’m expected to."
AI adoption has soared, yet sentiment is mixed: 41% of researchers see it negatively versus 32% positively.
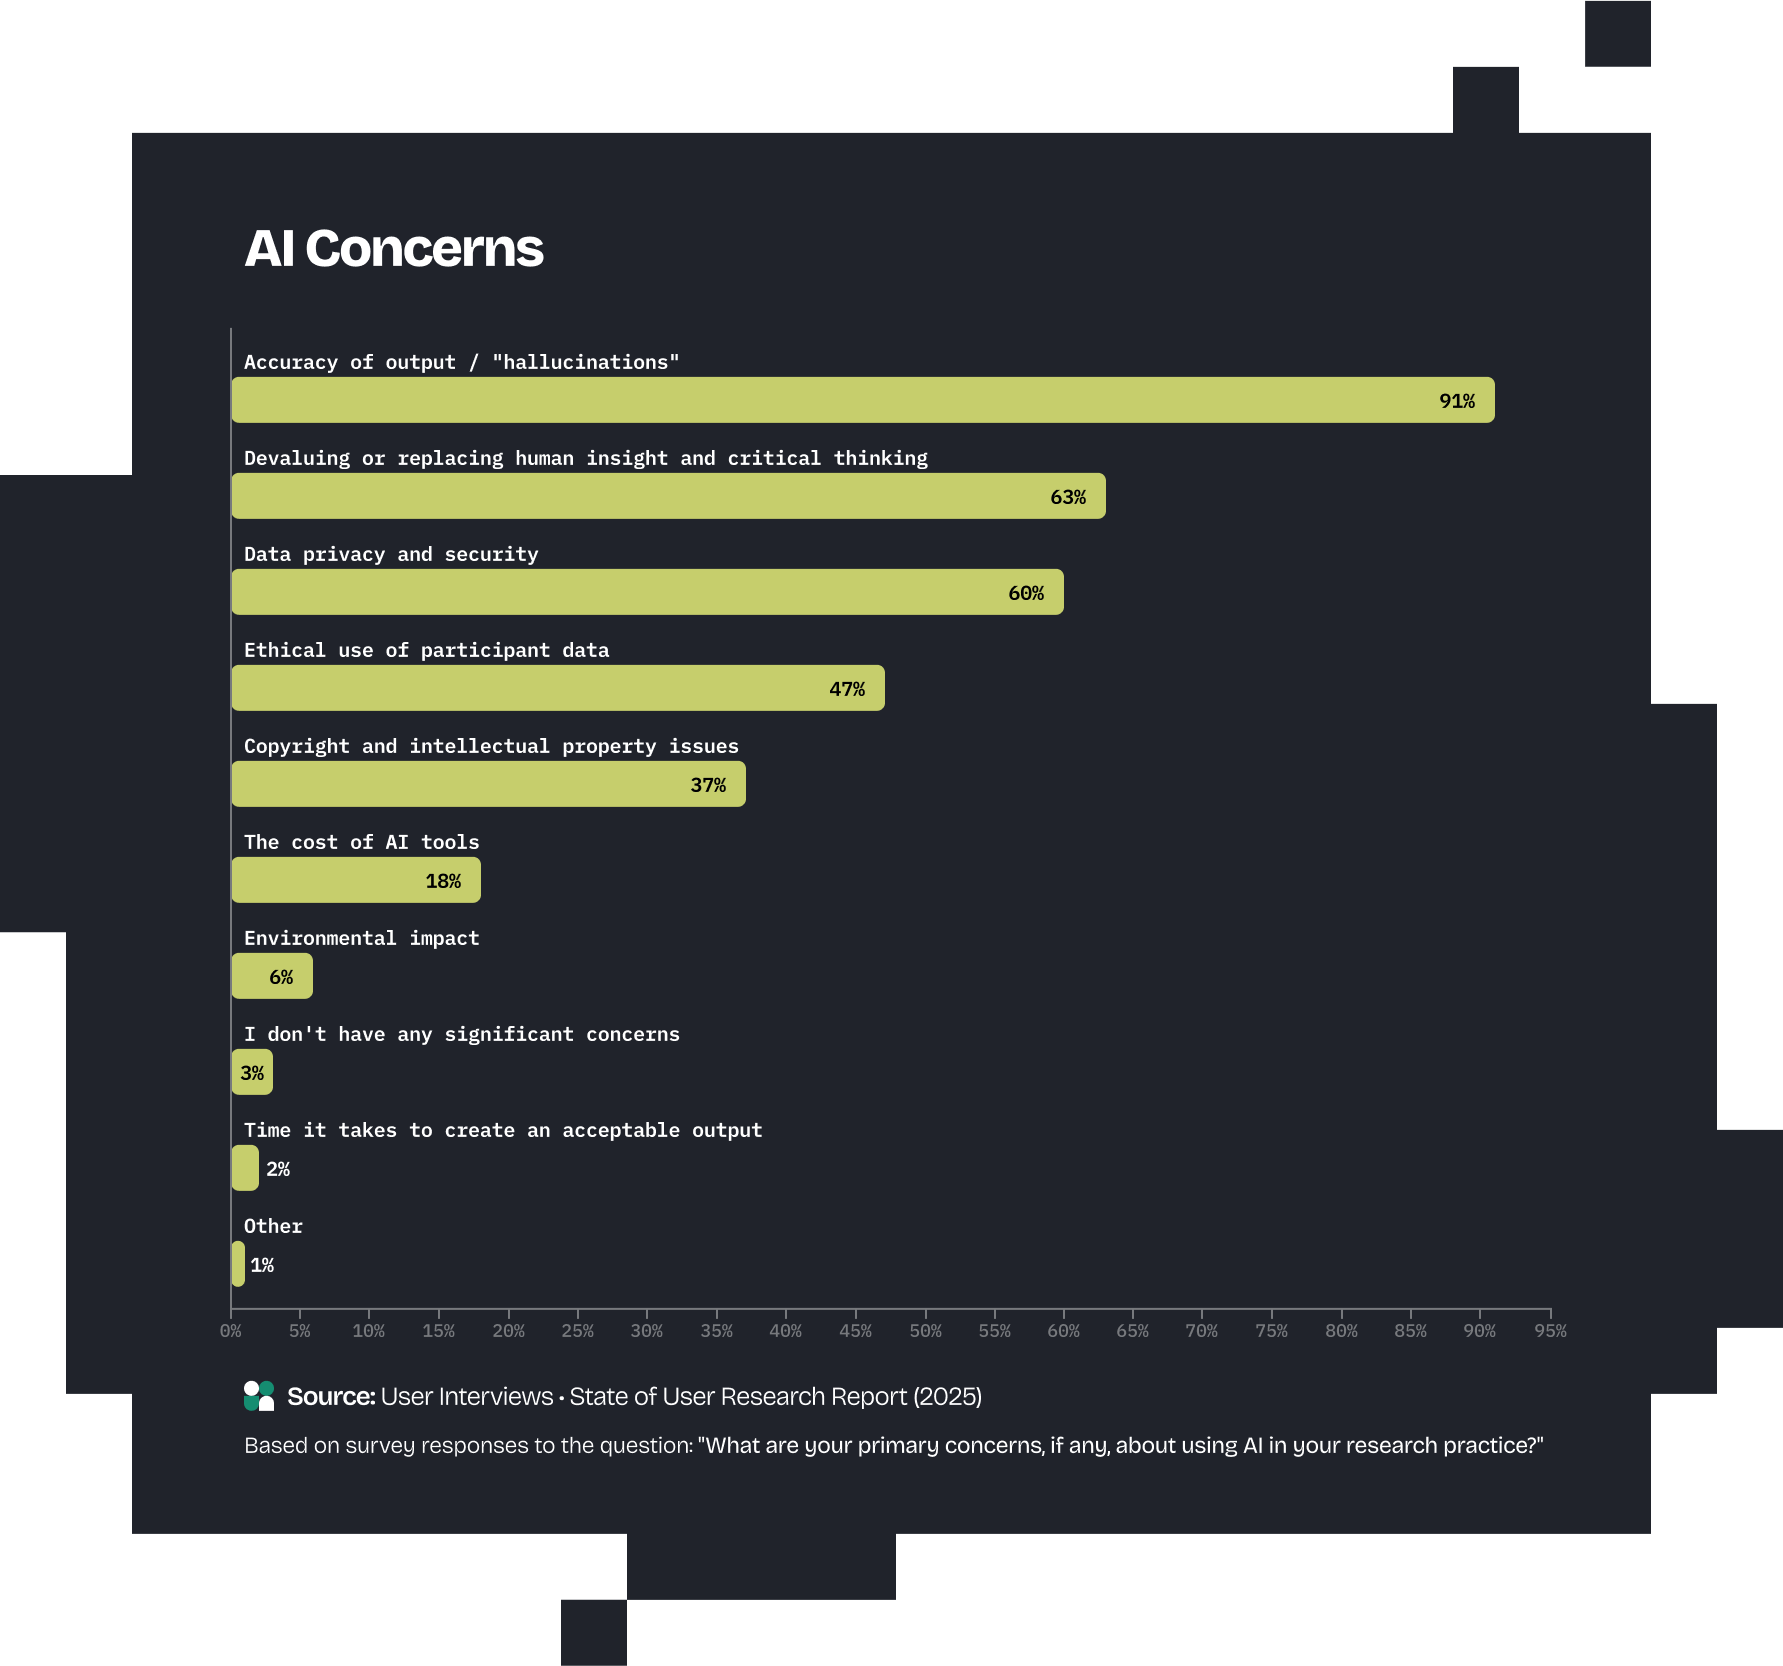
And for valid reasons: 91% of researchers worry about output accuracy and hallucinations, while 63% fear AI could devalue human insight and critical thinking.
Despite uncertainty, many research careers are still taking flight—but not always as traditional Researchers.
Over a third (35%) received promotions or took on additional responsibilities, while 20% transitioned into a new function at their current company or a new company.
It might be that, given all the transition, User Research is transitioning from a role to a multidisciplinary skill. Rather than democratization being that researchers help non-researchers do research, it could be that research is becoming much more important to other roles in product development. And it seems like researchers are the ones filling these roles.
“The role of research is pretty blurry today, including the role of every researcher who is sometimes many other things (a PM, a strategist, a project manager, a manager/mentor to others, etc.)”
Interestingly, more than half (63%) of respondents without a current UXR title had one in the past.
Among this group, nearly 57% felt confident that research would remain a core part of their role in 10 years.
These optimistic respondents tend to hold “UX” titles, including design (51%), have a median 9 years of experience, and 61% acquired their research skills outside a university setting.
We’ll be following up with a dedicated report on researcher identity, exploring how career paths, skills, and professional transitions are shaping the people behind research. Stay tuned for insights on who researchers are today — and who they’re becoming.

While AI is everywhere, promising faster, smarter, easier research, researchers aren’t necessarily doing more research. Median output has barely budged compared to 2024: Researchers said their projects consist of 2 mixed methods, 3 qualitative, and 1 quantitative study in the past six months.
AI is moving at supersonic speeds, but the ROI of AI in research is still up for debate.


“I am constantly learning from both our users and my teammates who always strive to learn more about different research methodologies while challenging what is ethical and how we can be more inclusive.”
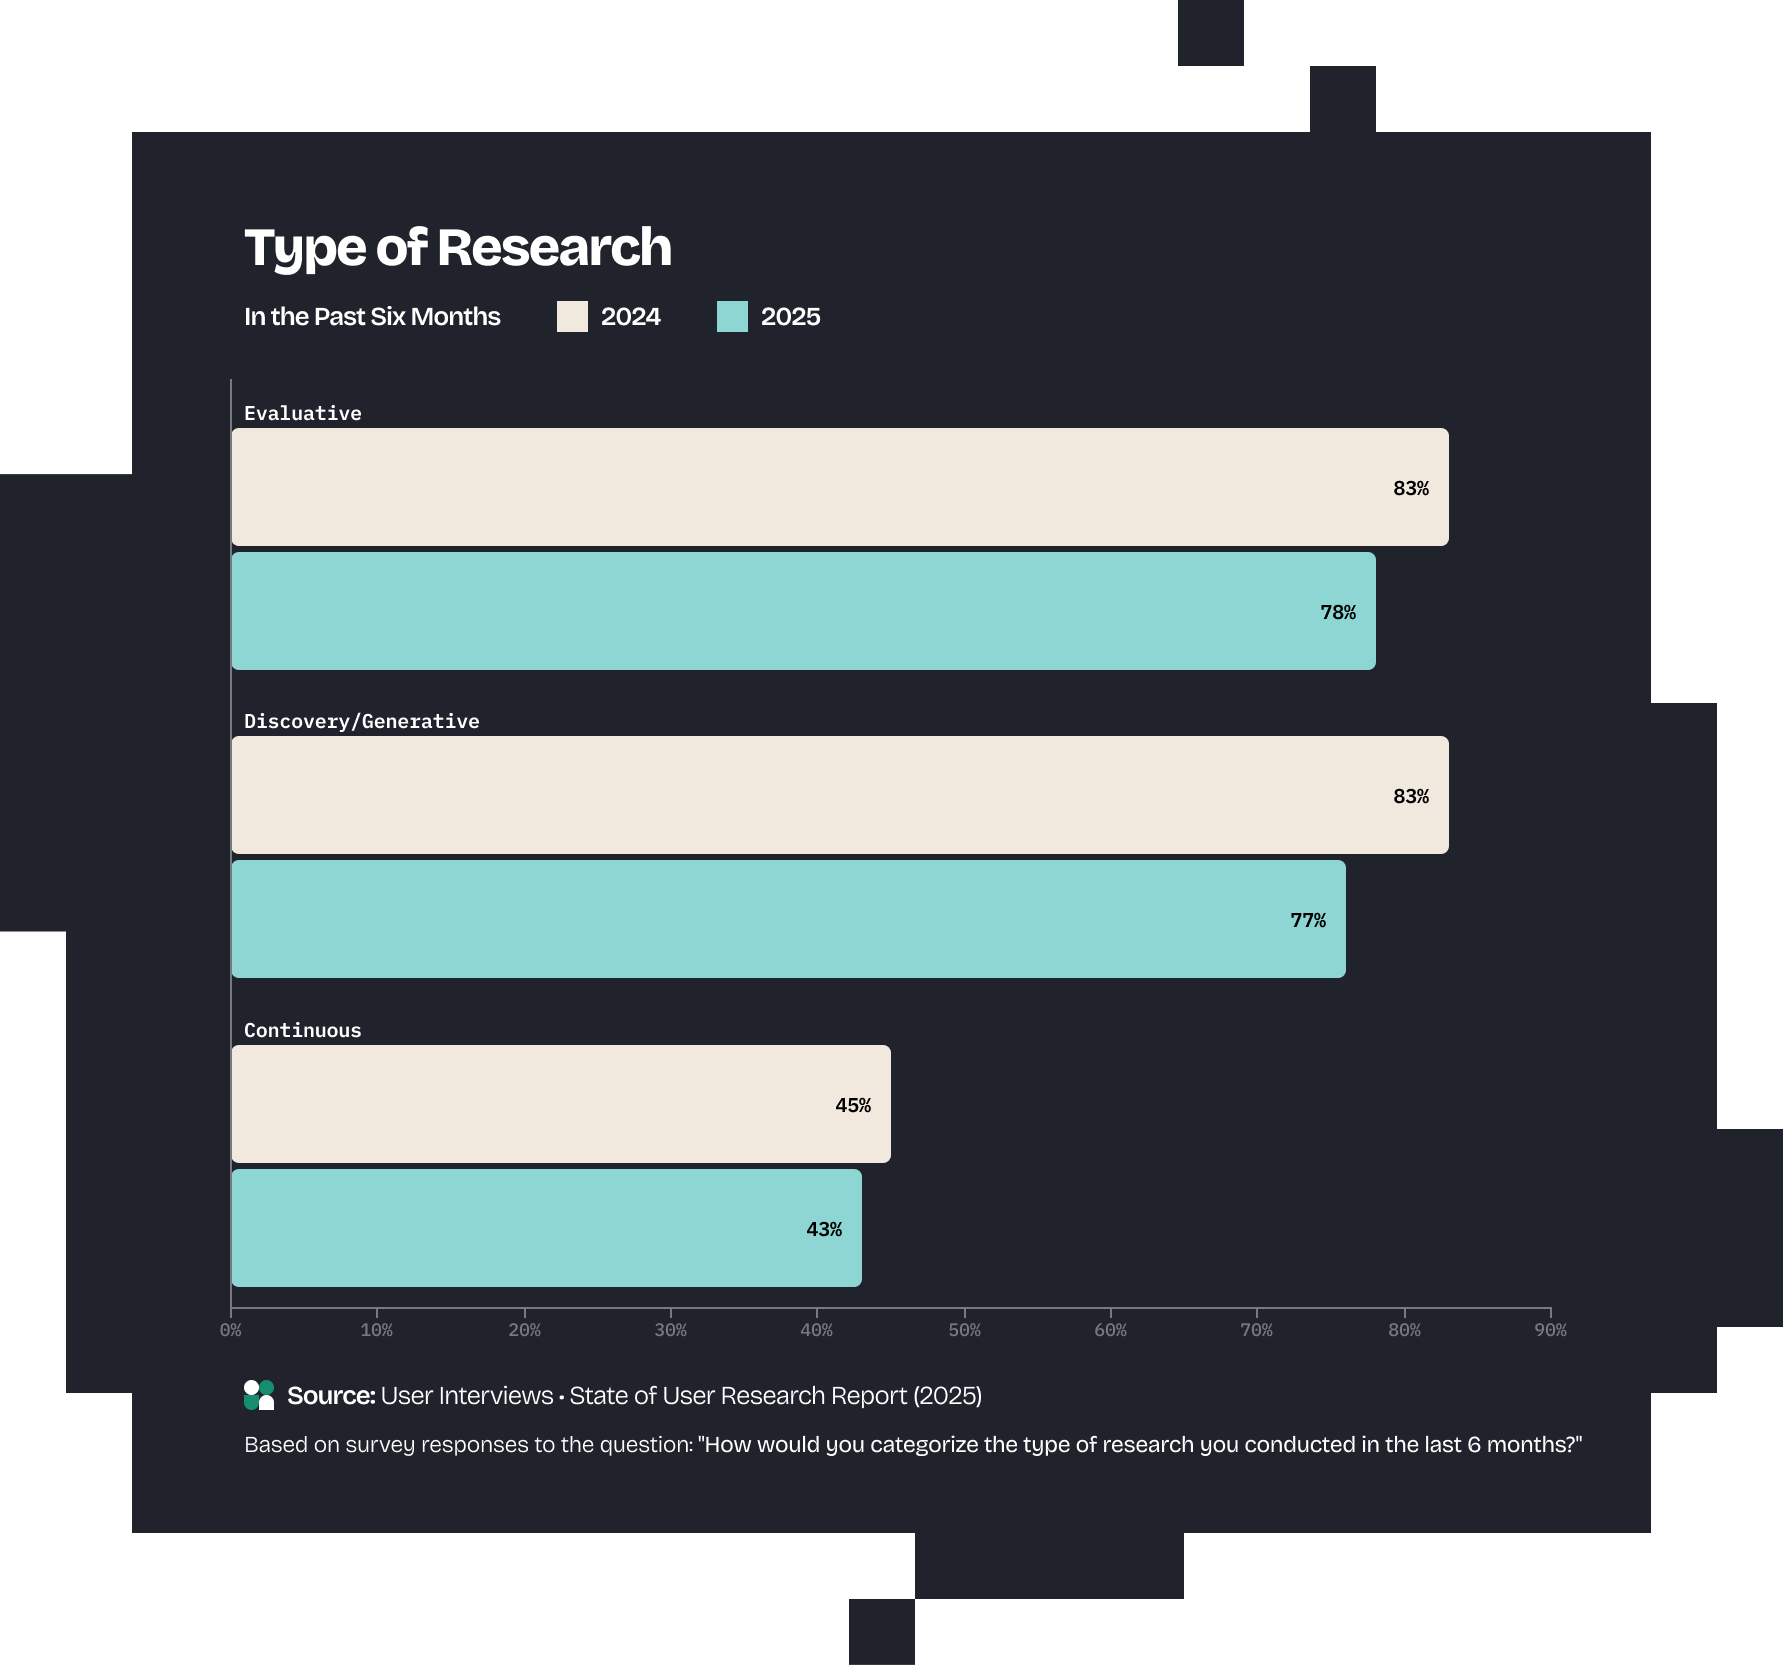
Evaluative research is still the most popular research type, but the percentage of those who said they completed this type of study declined 6 points to 78%.
Discovery/Generative research declined 7 points to 76%—however, this might be partly due to broadening the term in the survey itself to include generative research (previously we only mentioned “Discovery.”)
Additionally, AI might be enabling researchers to experiment with new methods—both in tool use and for developing AI tools themselves—which more than half of researchers (54%) said they did in 2025.
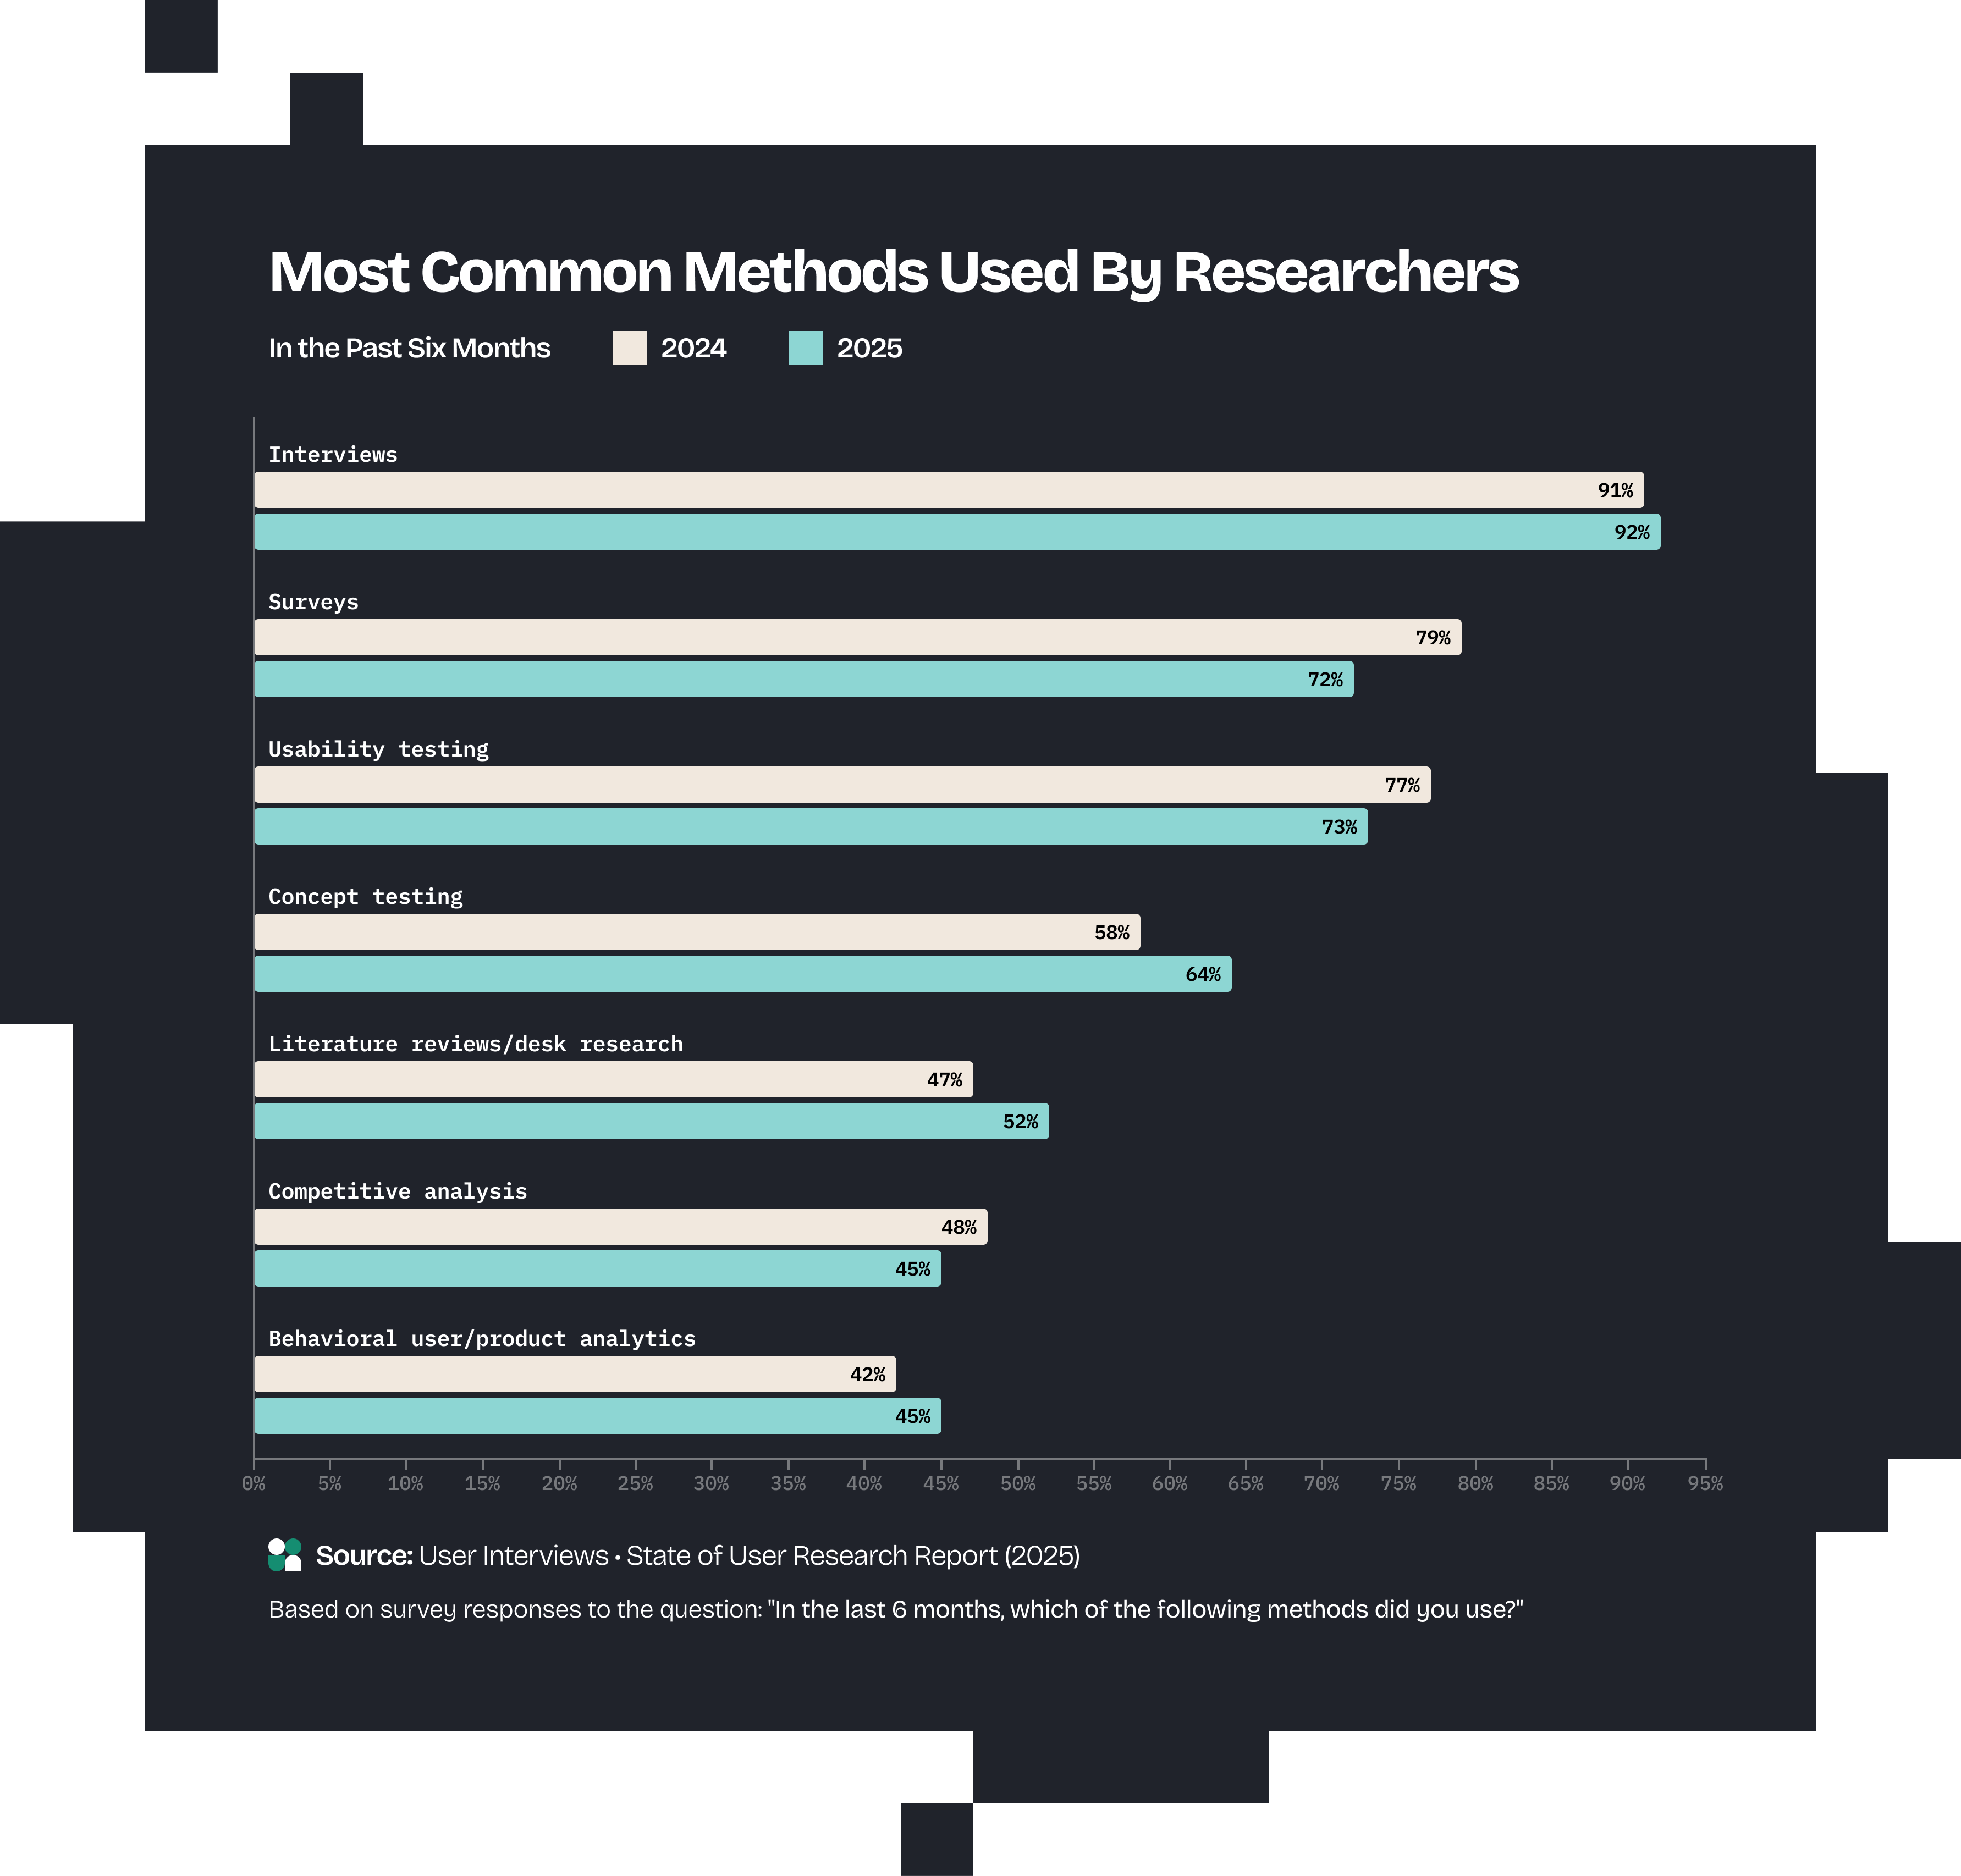
For example, concept testing is gaining traction in the field, up 6 points year-over-year (64%). This might be because companies are trying to find ways to embed AI into their products, which may lead to more of this type of exploratory design method.
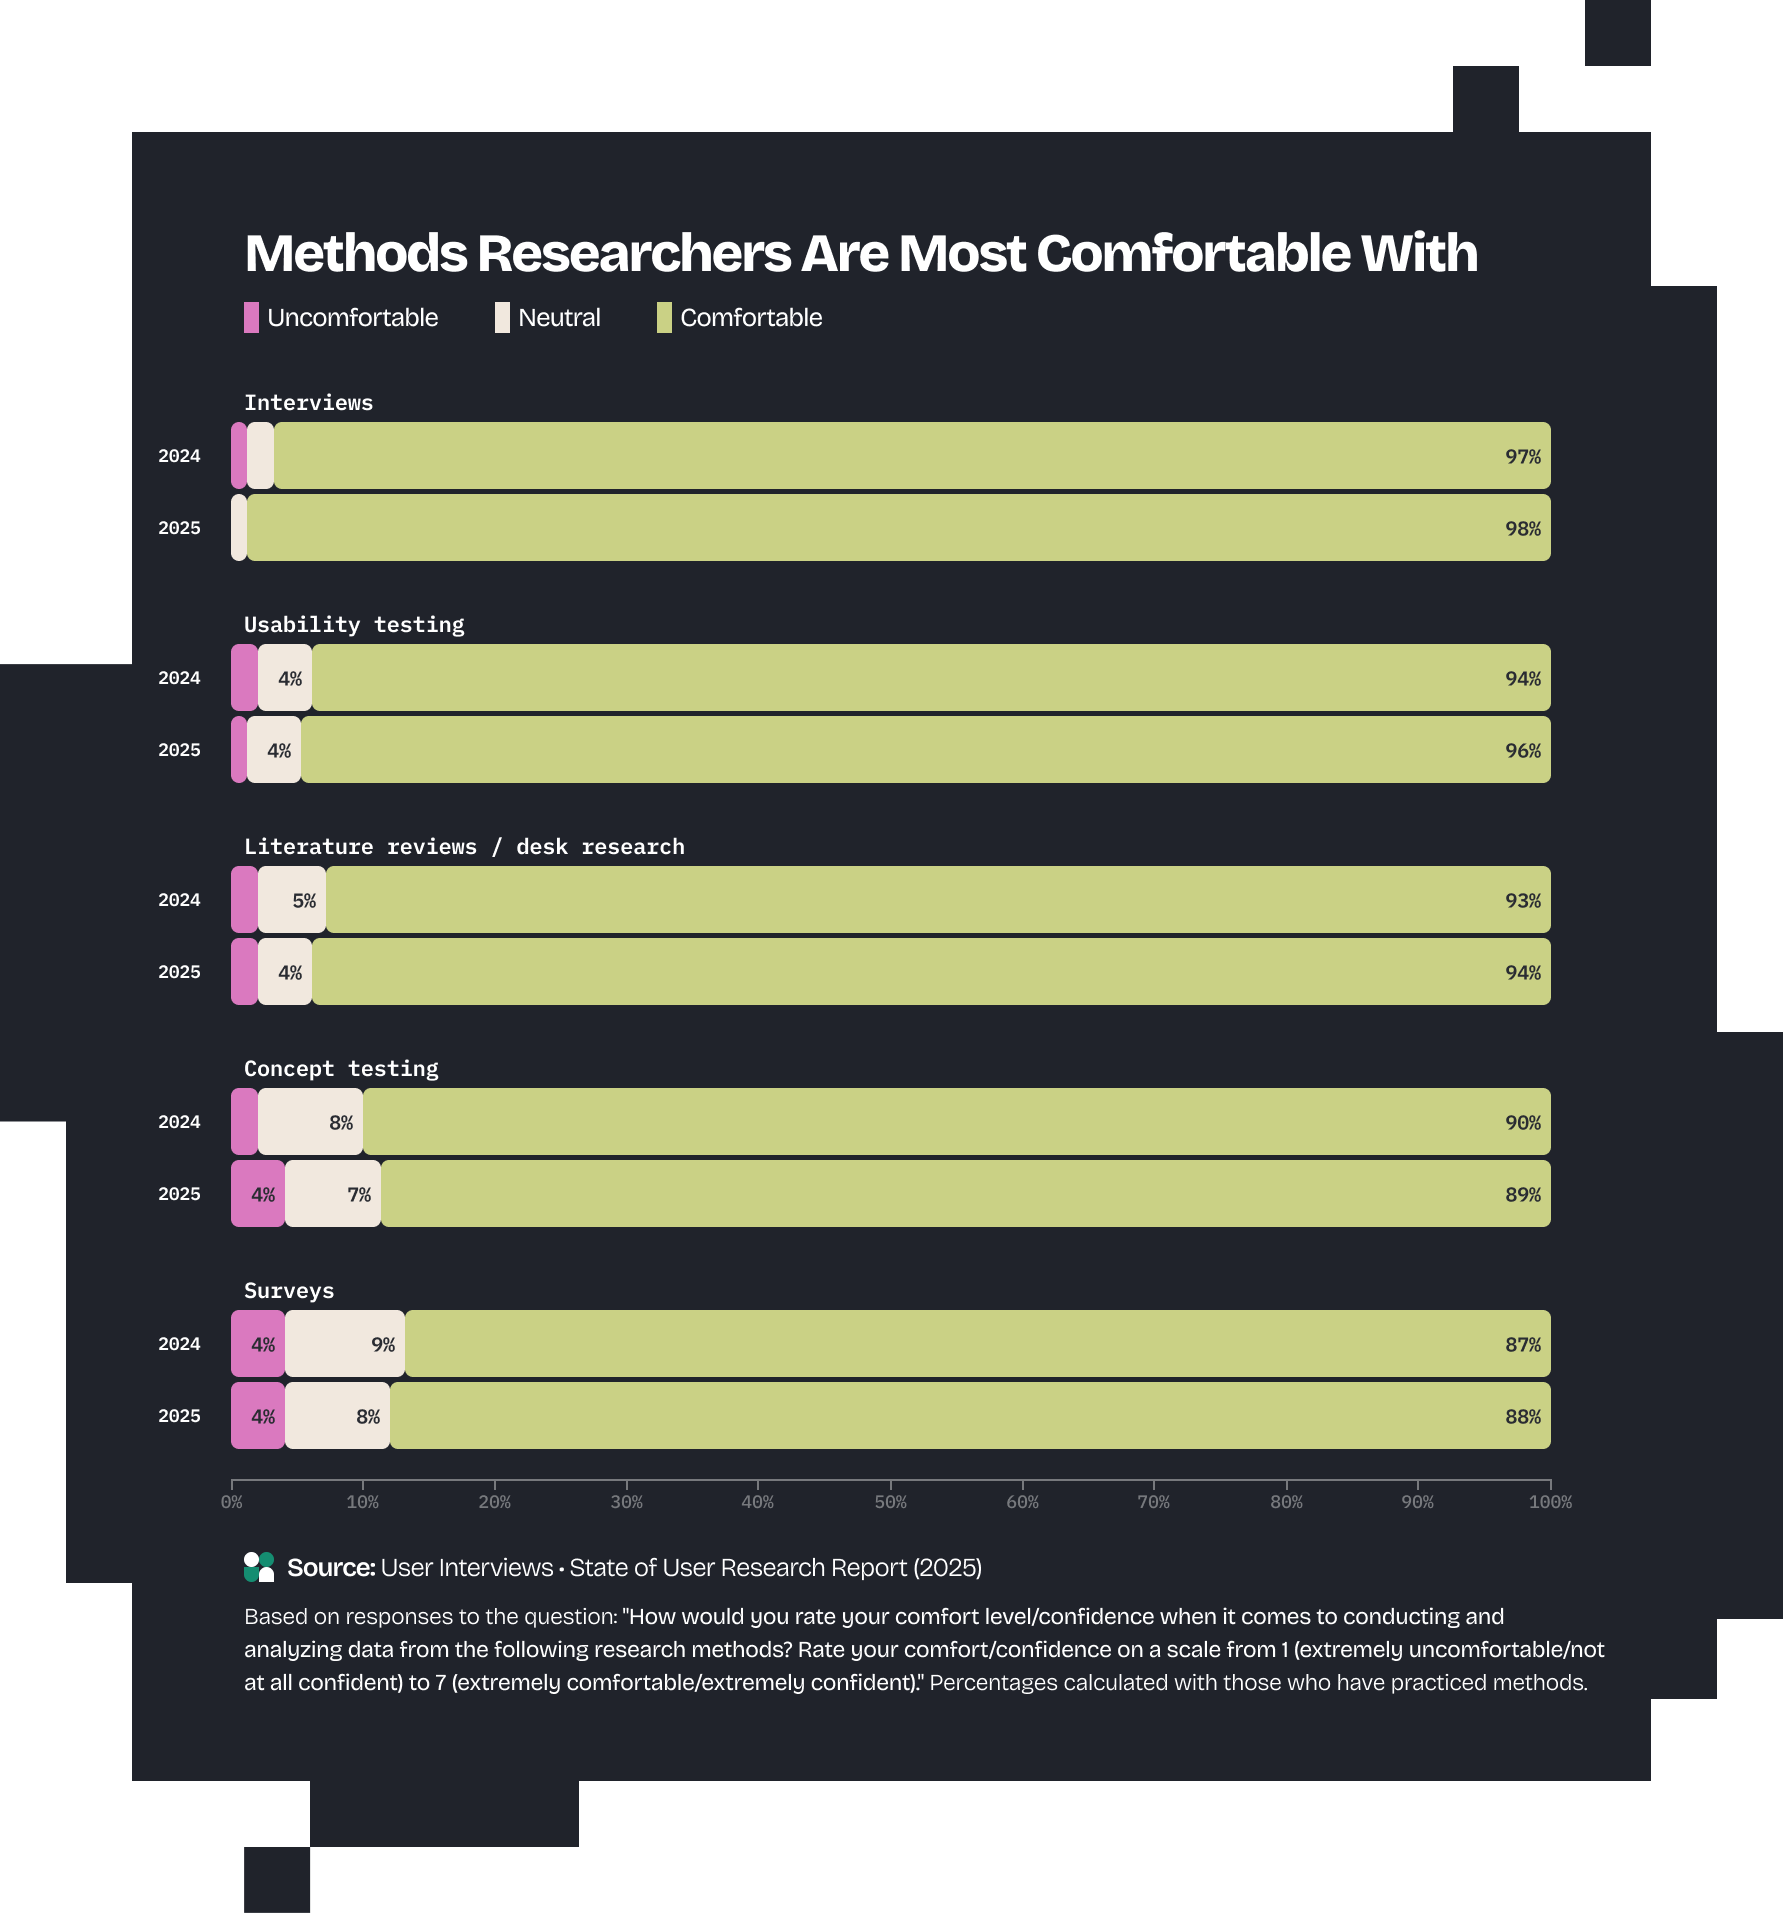
A previous version of the "Most Common Methods Used By Researchers" chart was incorrectly labeled "Heuristic Analysis" as the most common method. We updated it to correctly display "Interviews."
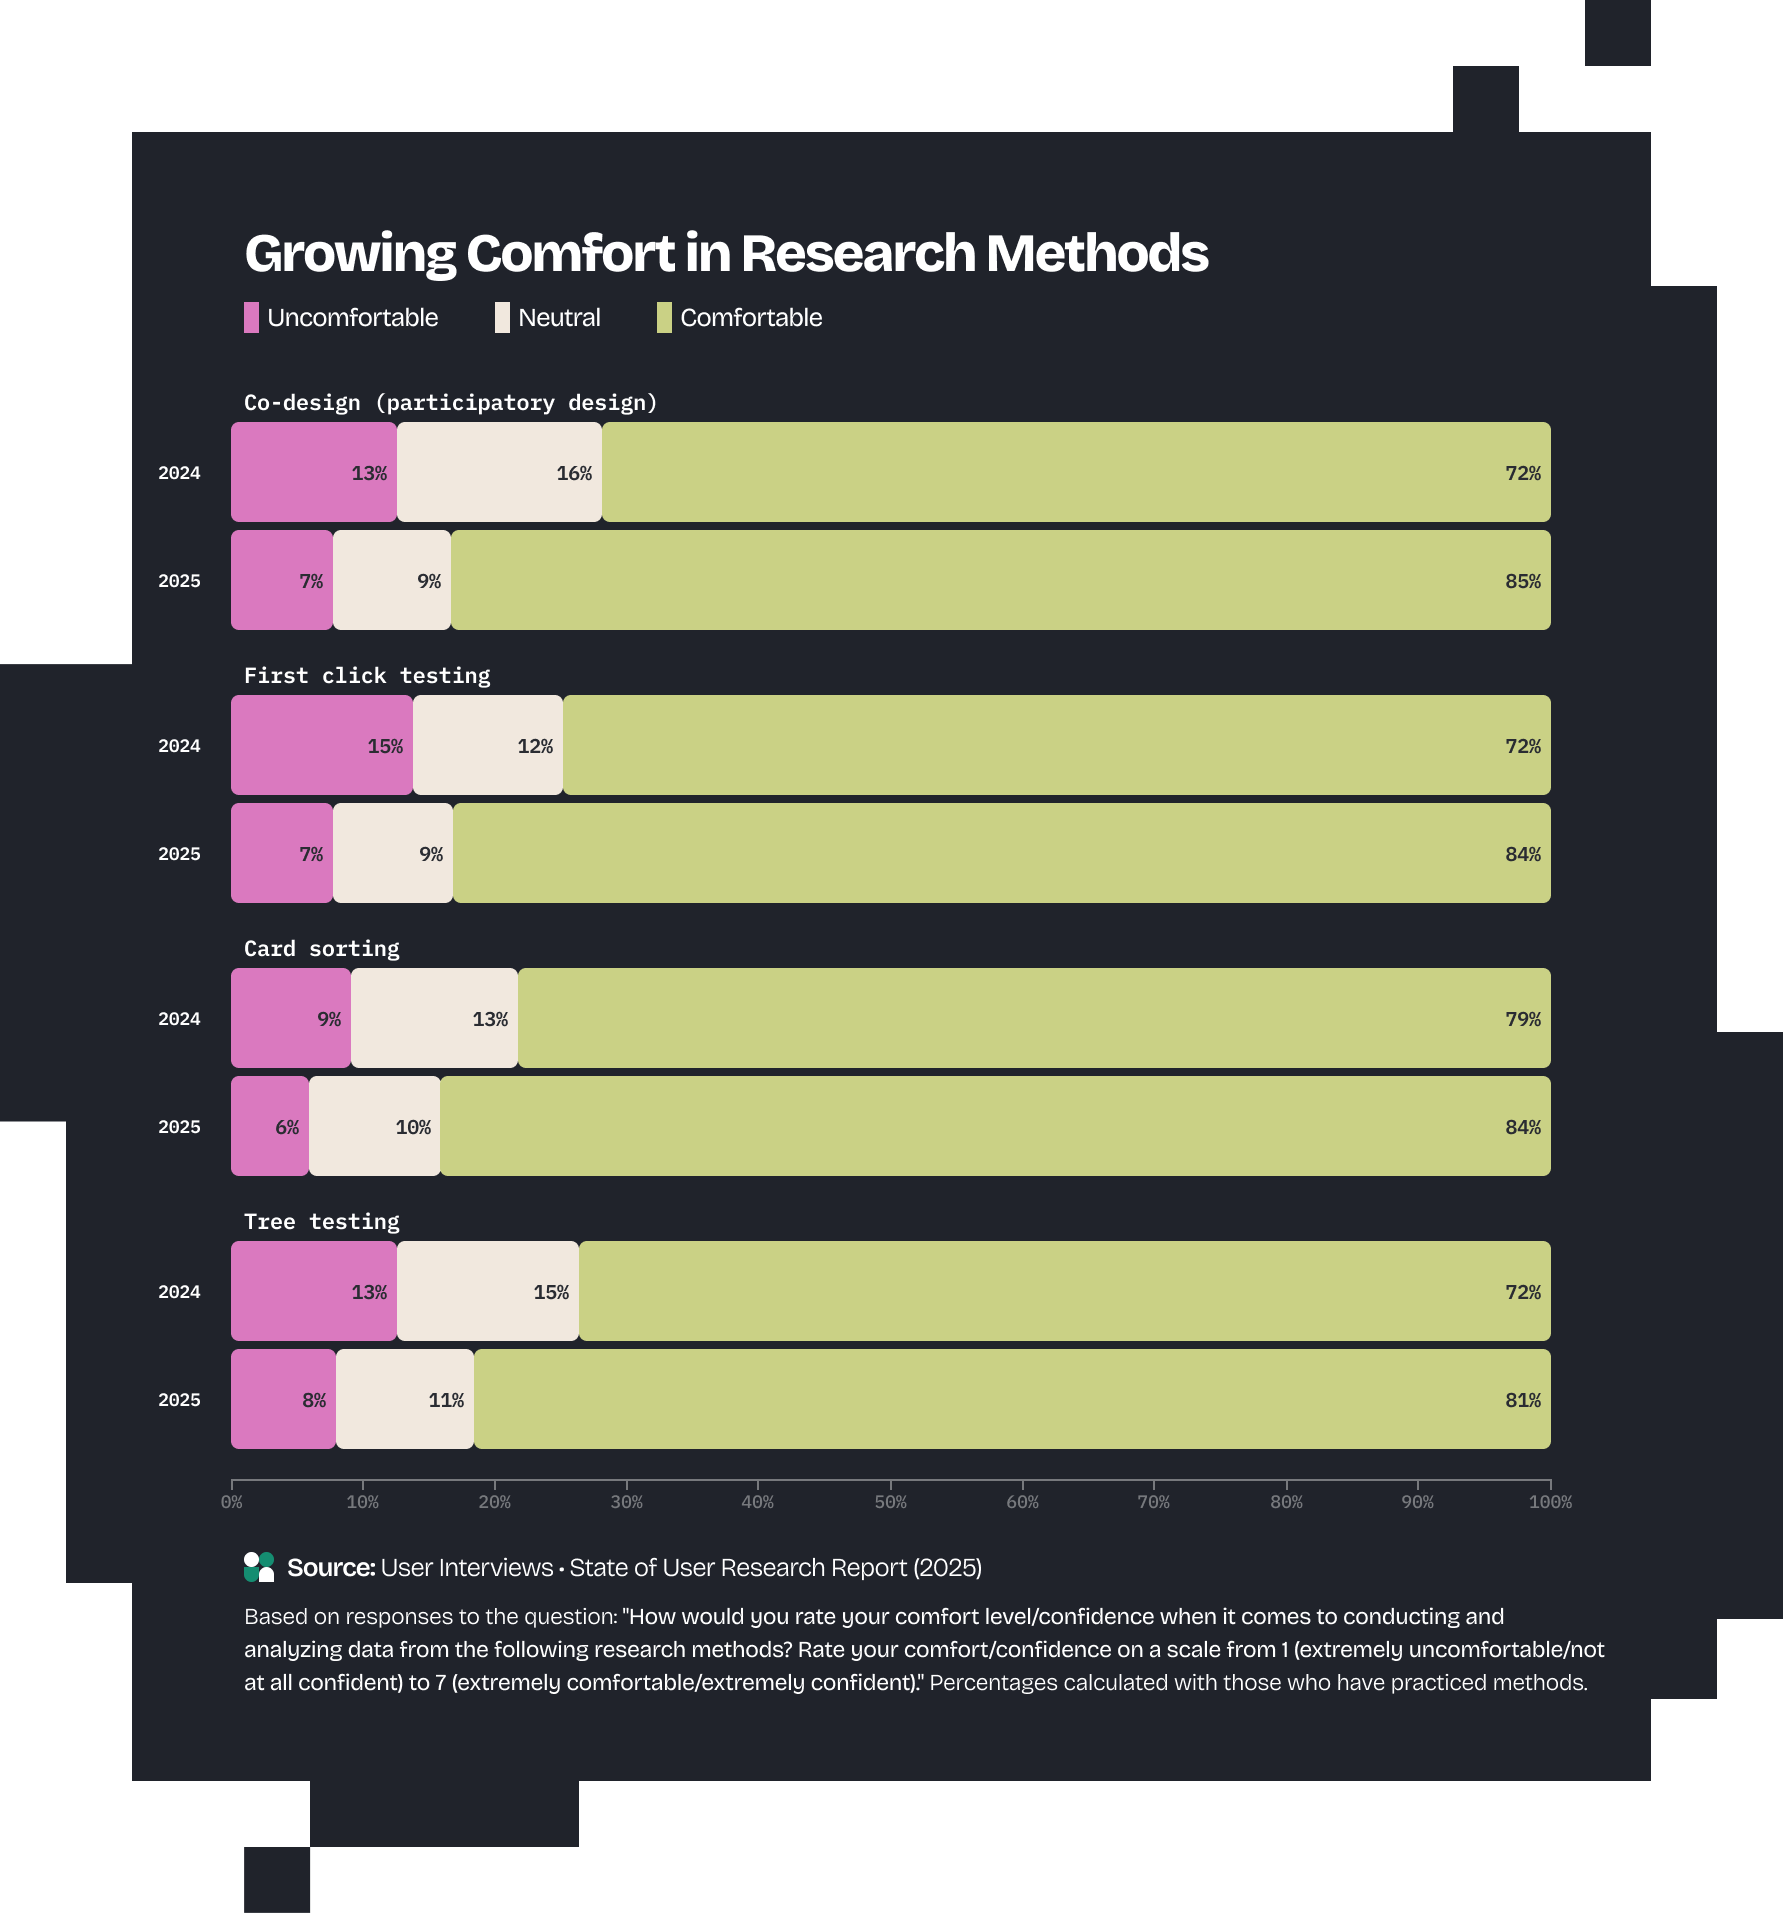
Additionally, comfort has increased notably in co-design (+13 points to 85%), first-click testing (+12 points to 84%), tree testing (+9 points to 81%), and card sorting (+6 points to 84%).
We’re taking a closer look at how research craft varies across titles, geographies, industries, and organizational structures — uncovering patterns in methods, workflows, and experimentation. Stay tuned for the full breakdown!

Even with bigger conversations about the business value of research over the last year, just over half of respondents (52%) said that expectations around demonstrating research impact/ROI doesn’t actually influence the types of research they prioritize or conduct.
In practice, research methods are guided not by cut-and-dry ROI, but by pragmatism: the most common factors were the type of question a research team needs to answer (87%) and the project timeline/speed required (74%).

“[It’s] hard to stay motivated after seeing user researchers being laid off at my company. It often feels like the discipline isn’t truly valued. I constantly feel the pressure to deliver impact and achieve excellent results because of this.”
Anecdotally, we’ve heard people feel that the challenge to track impact well relates to industry layoffs and plateauing resources (i.e., if you “prove” the business value, you can “save” research from being affected by budget cuts or gain new resources).
Our sample shows that researchers feel like they have a lot of room to grow in this regard: only 21% of respondents who tracked their impact, either qualitatively or quantitatively, were satisfied with their methods.
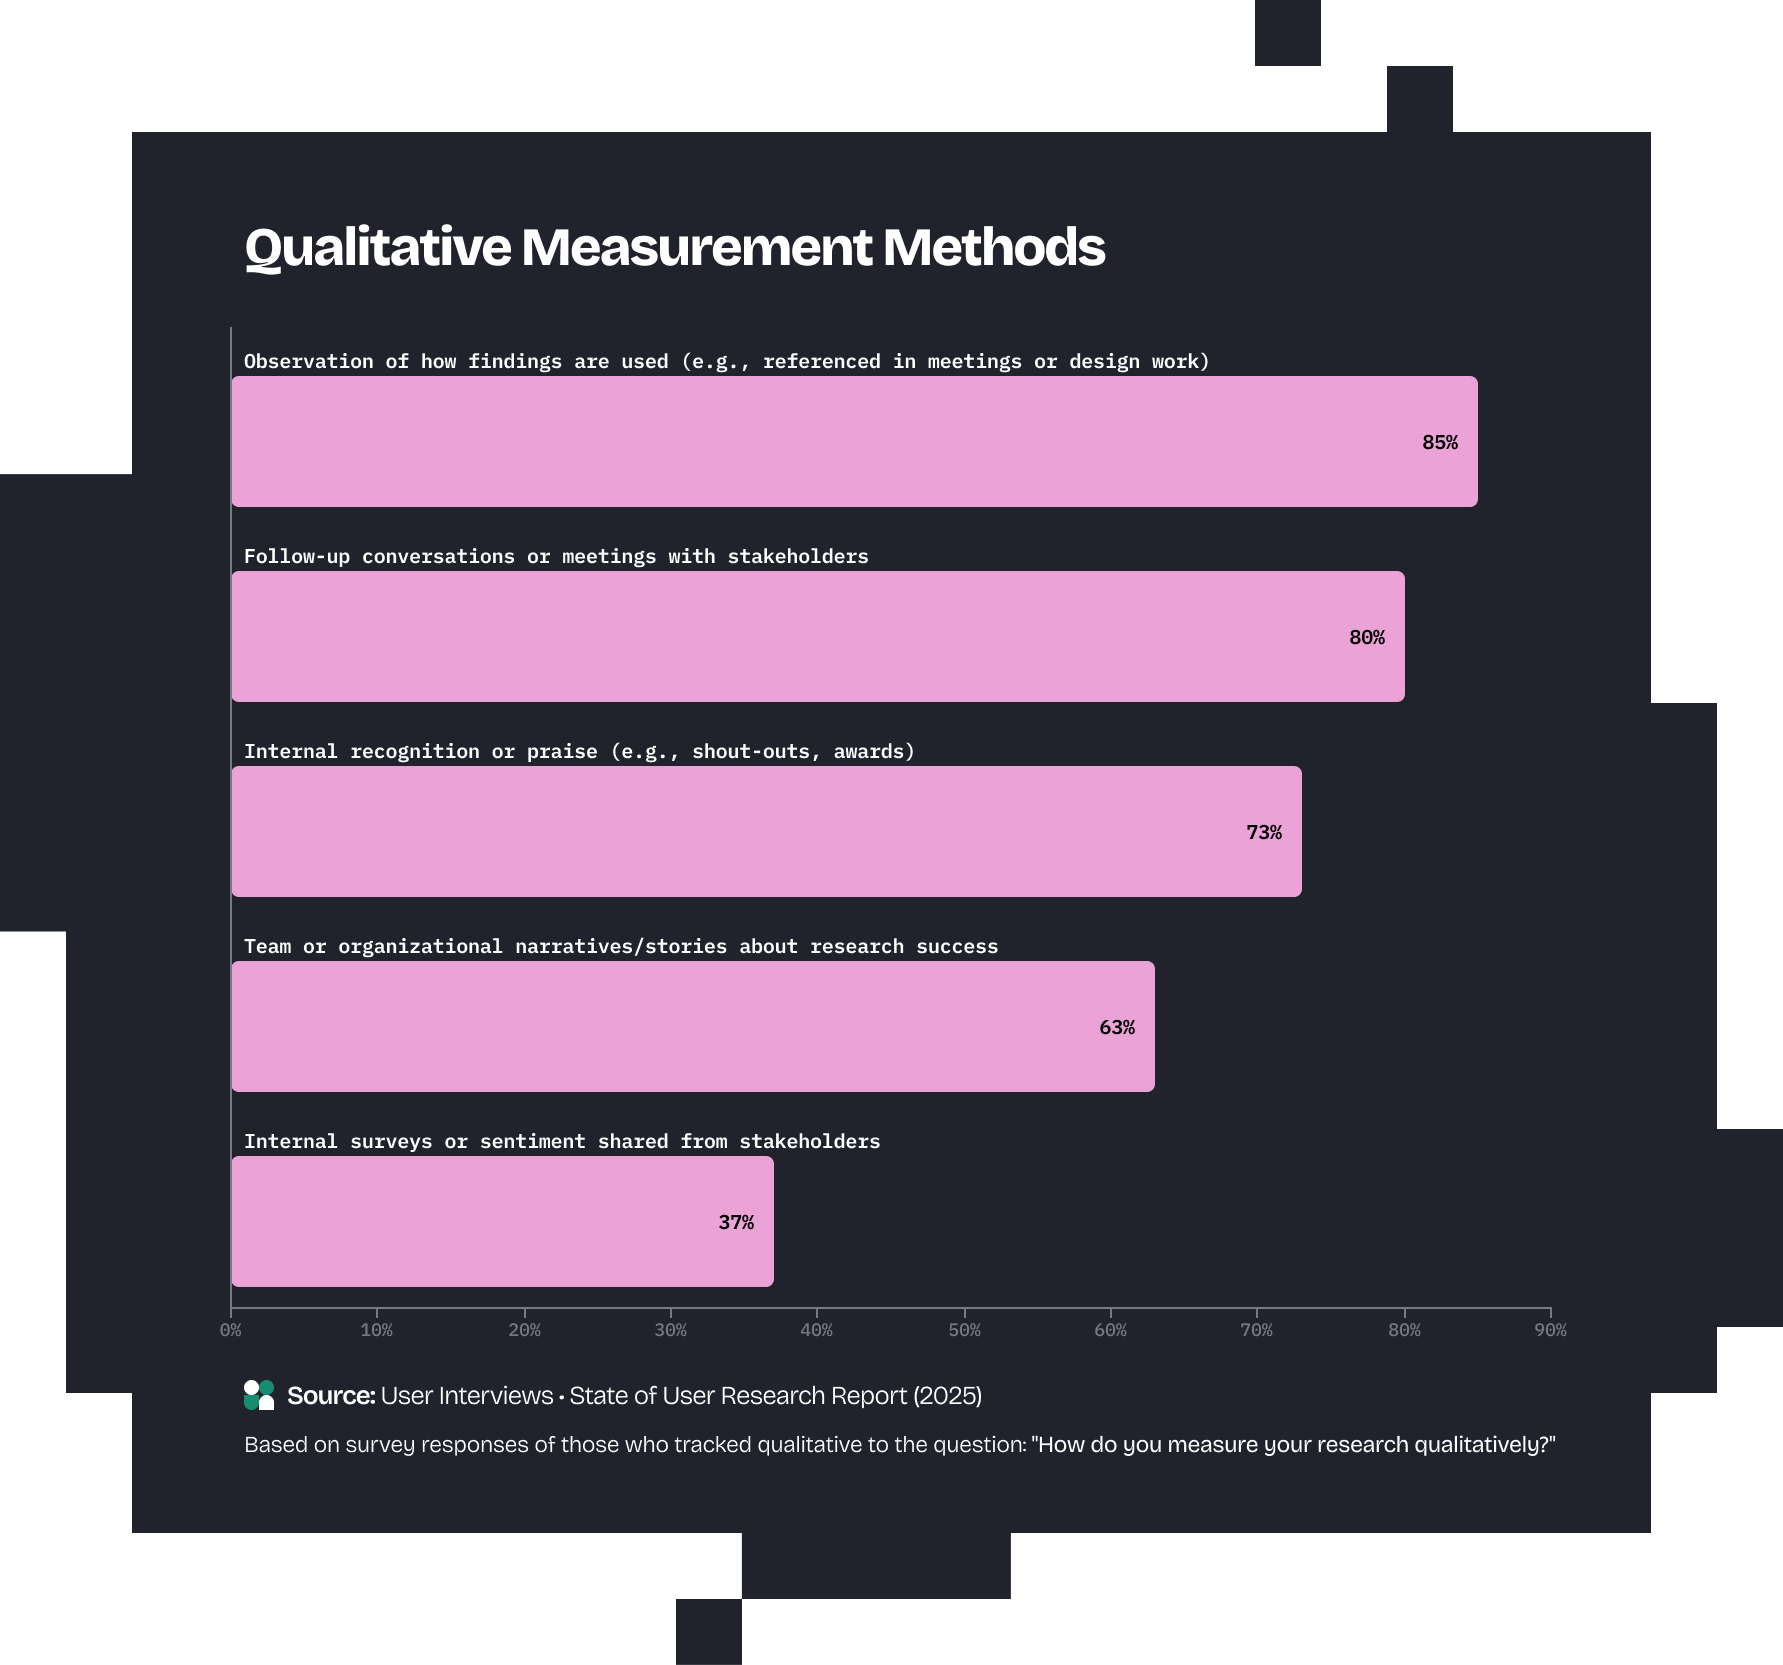
A striking 83% of respondents said they qualitatively measure the effect of their work, most often through observation of how findings are used (85%), follow-up conversations or meetings with stakeholders (80%), and internal recognition or praise (73%).
More than half (54%) of researchers do not track research impact numerically.
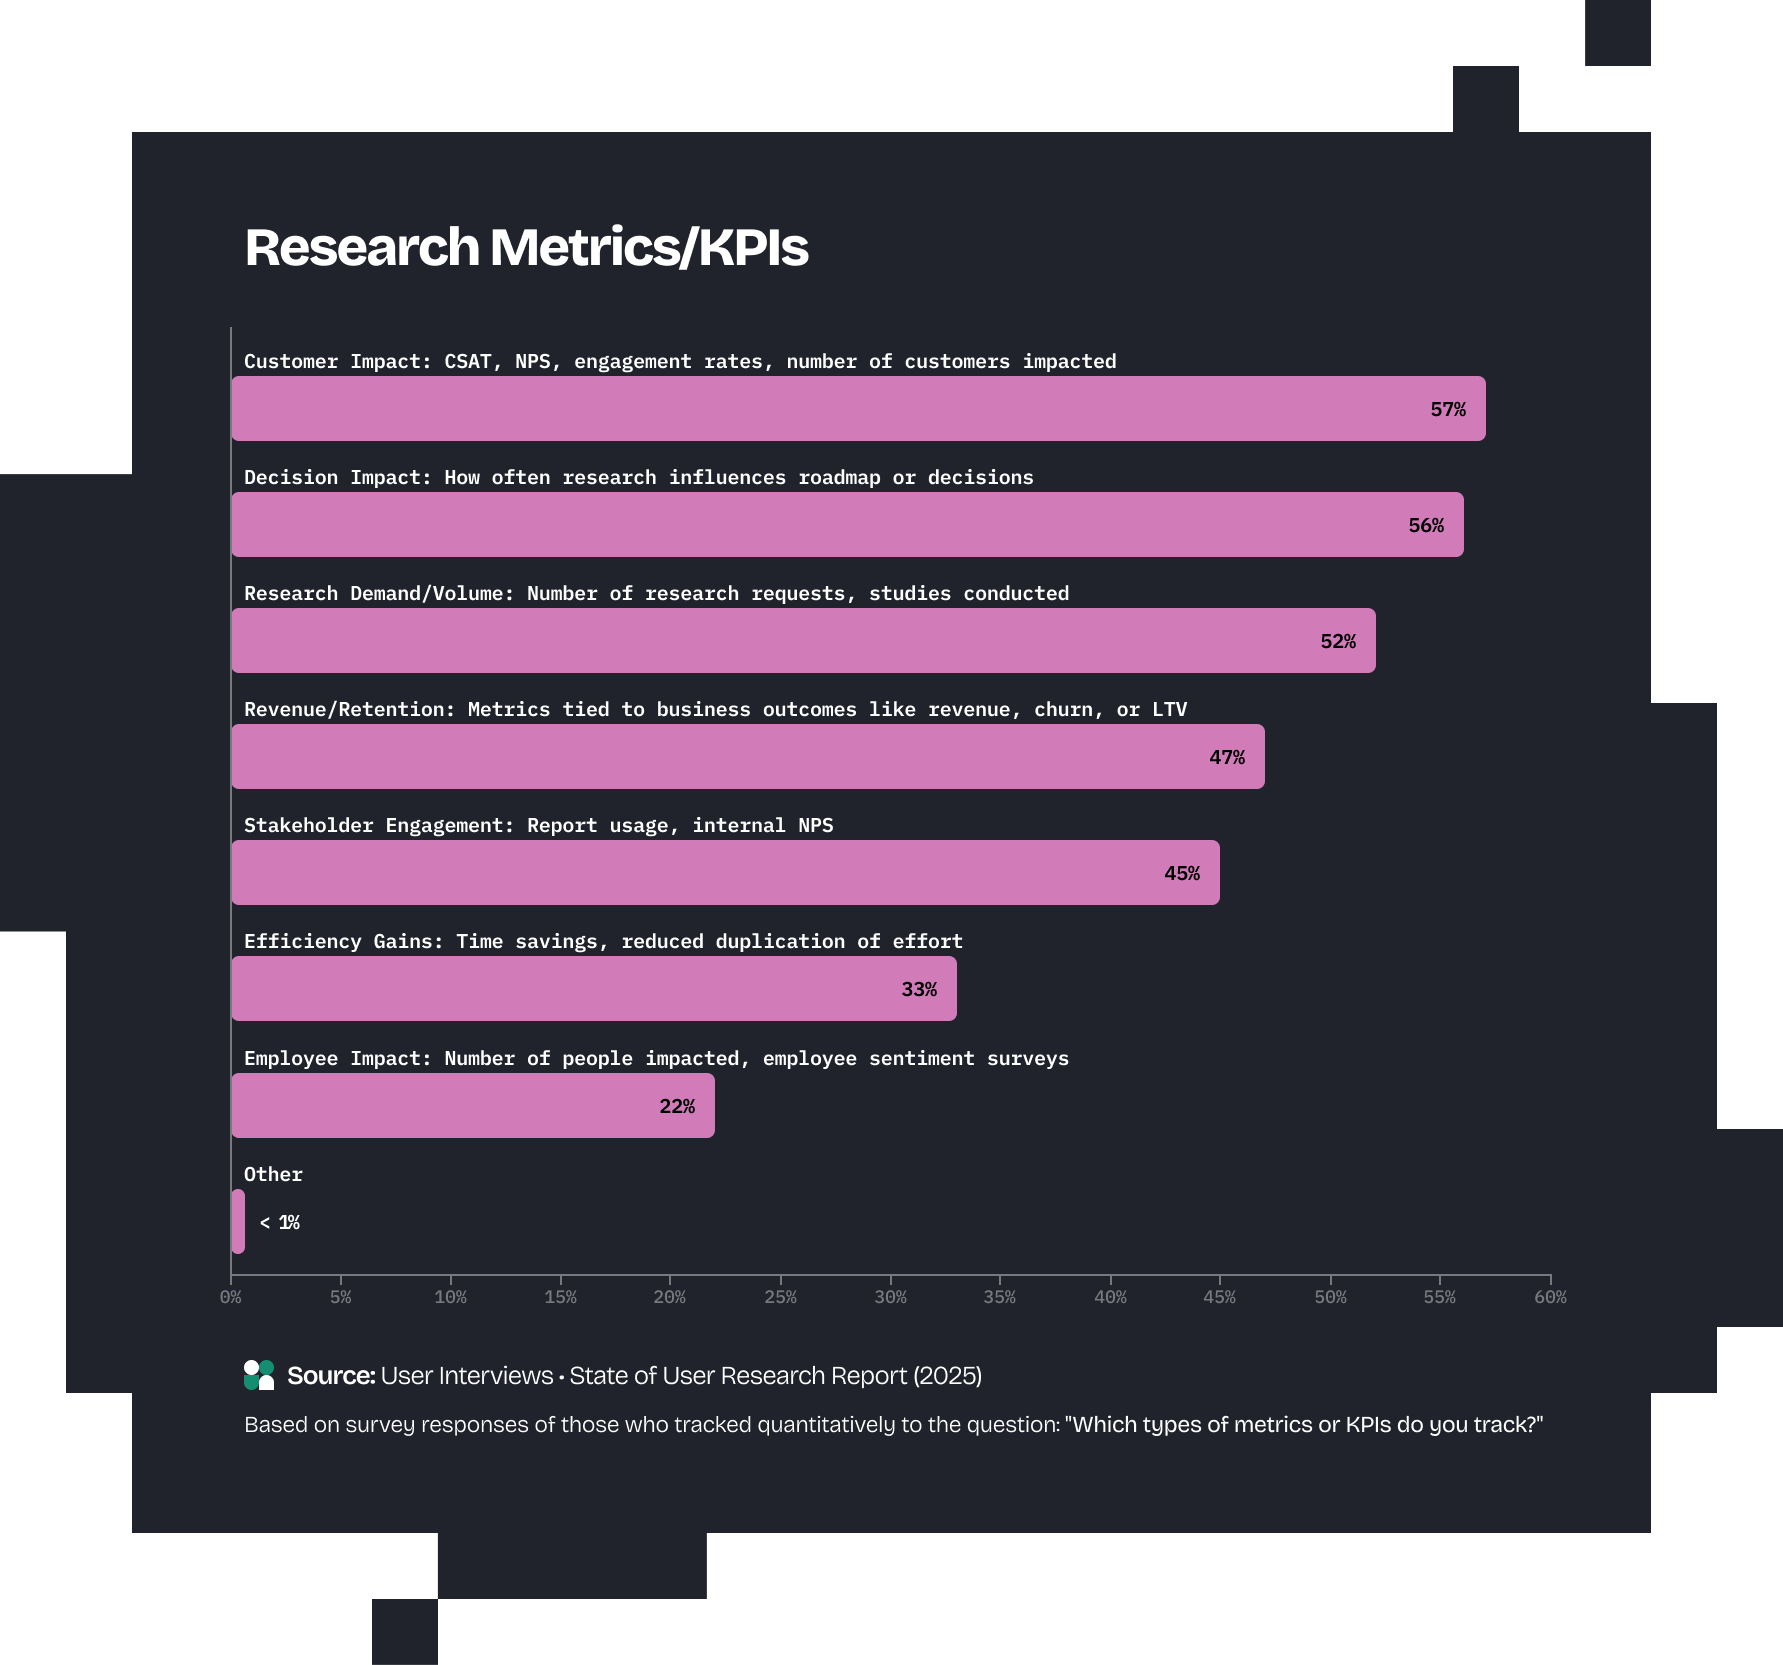
Among those who do, top metrics include customer metrics, like NPS or engagement rates (57%), decision impact, including how often research influences the roadmap (56%), and research demand, such as the number of research requests or studies conducted (52%).
A majority (59%) of researchers who do track impact rely on spreadsheets or documents. Many also use automations: 27% use dashboards or reports created in BI or analytics tools and 20% leverage integrations with tools (like Asana, Notion, Jira, or Airtable).
Dive deeper into on-the-ground research strategies, highlighting how approaches vary by title, geography, industry, and organizational structure in our State of Research Strategy 2025 report.

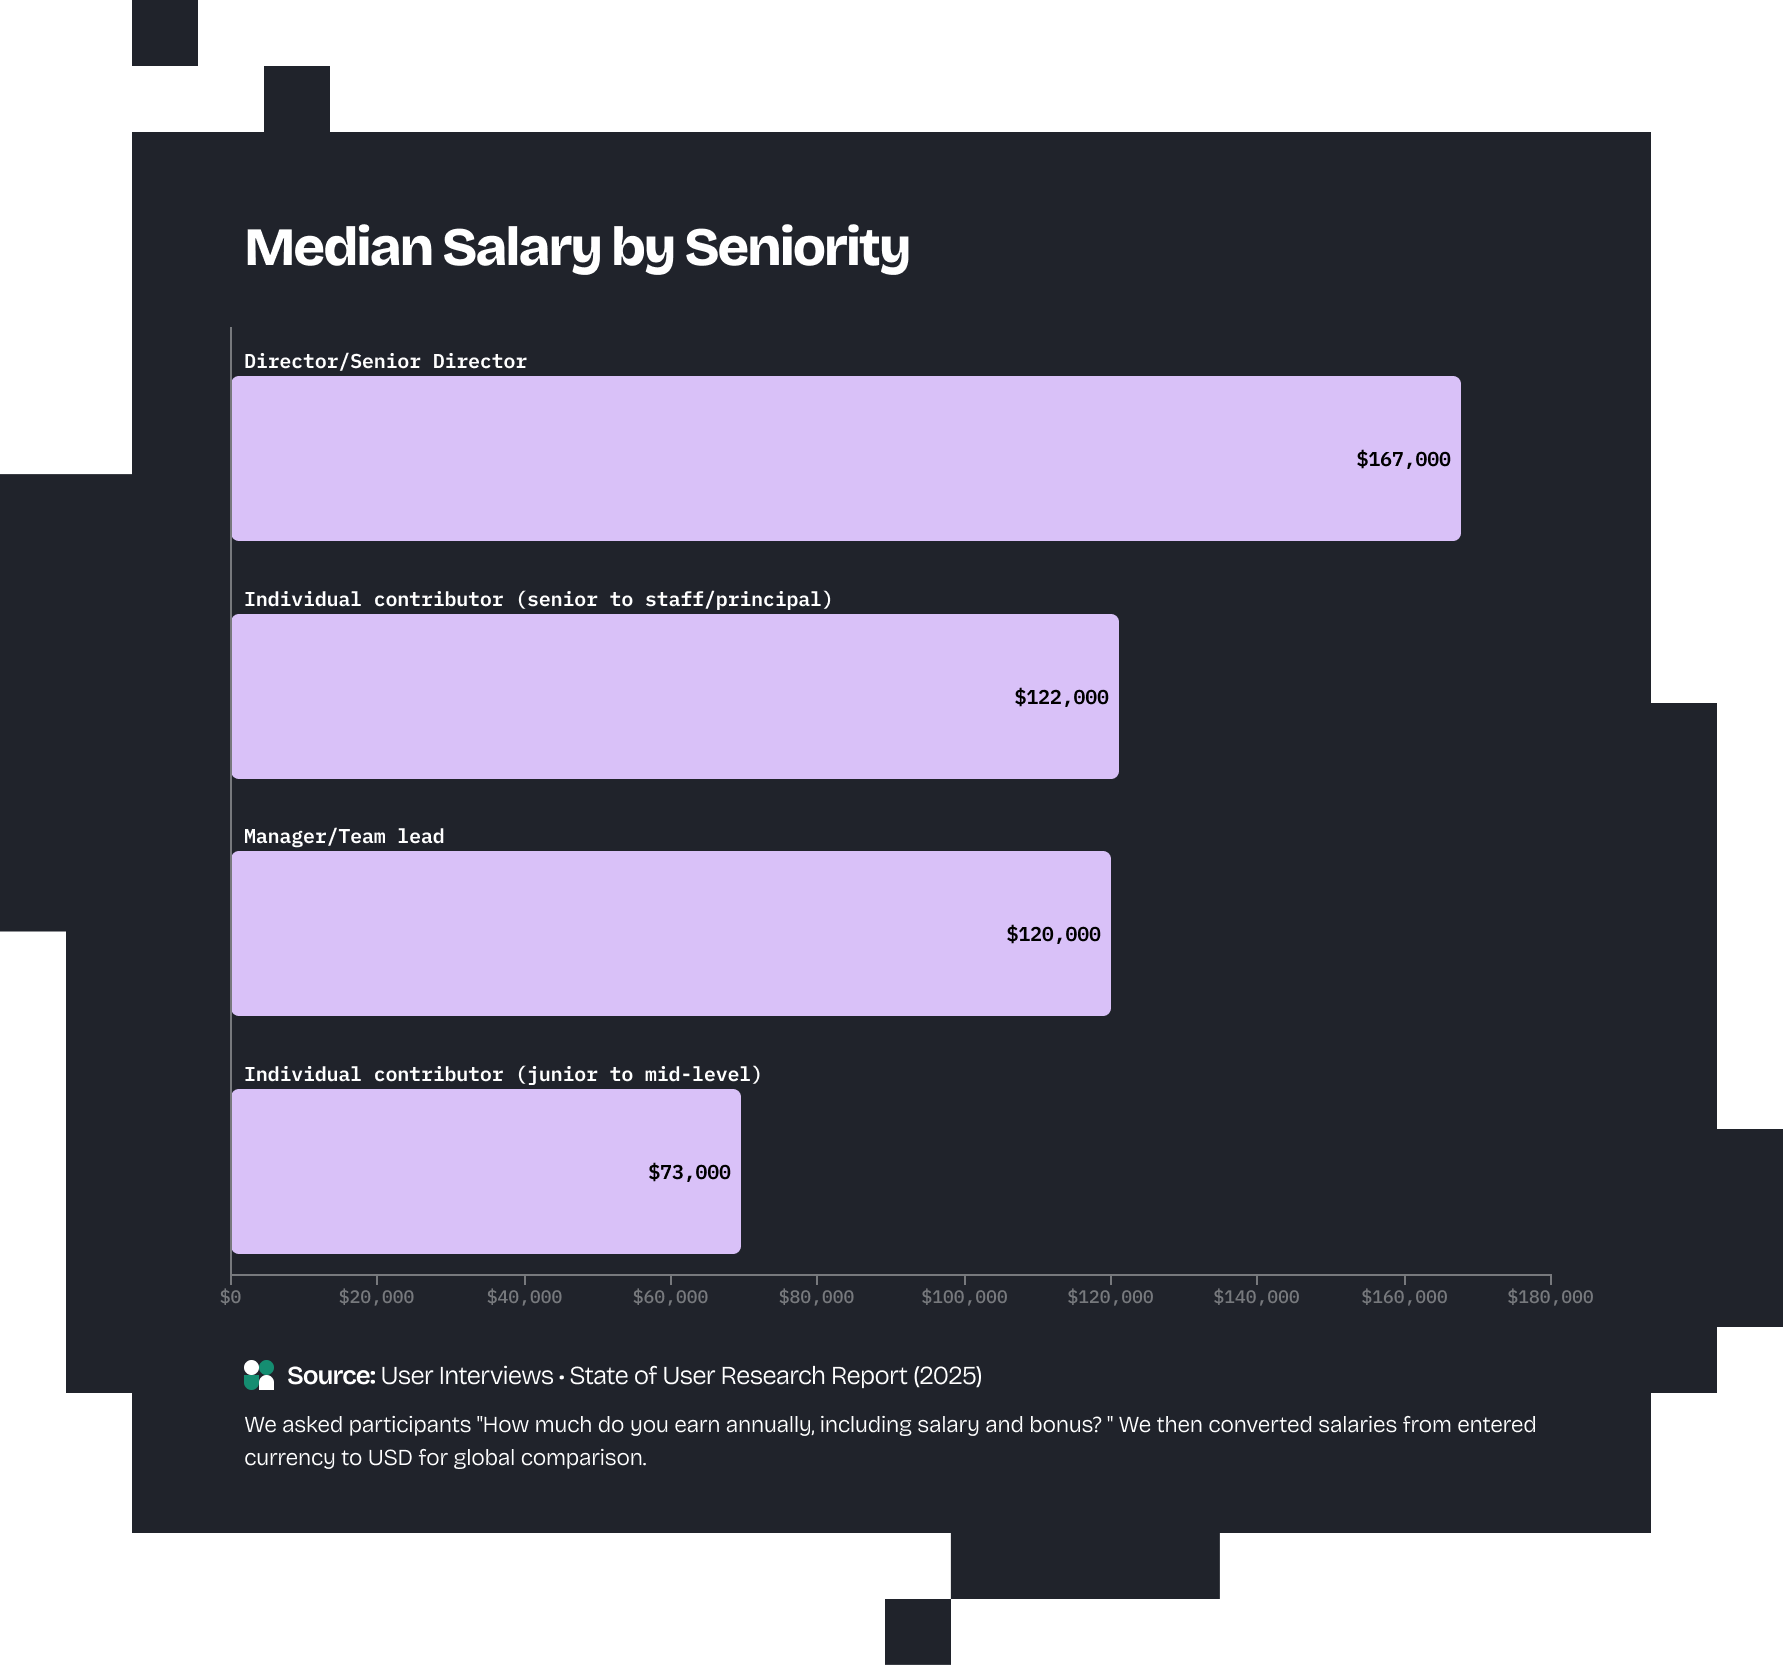
Yes, the global median salary for researchers in 2025 was $105,500 — a nearly 8% increase from 2024. The range of salaries for 2025 was also wider in comparison than 2024’s sample.


In terms of seniority, this breaks down to:
Note: In our survey, senior ICs have a median salary of about $122k (confidence interval: min $108k – max $130k), while managers/team leads have a median around $120k (confidence interval: min $100k– max $131k). Because we had fewer managers in our sample (51 vs. 199 senior ICs), there’s more uncertainty in their salary estimate. This means it’s not certain that ICs actually earn more—different samples could show the opposite.
While this shows promising growth, there’s more to the story: how salaries vary by role, region, and experience, and what’s driving these changes. Read the full 2026 UX Salary Report!

Things have been relatively smooth in Research Operations. Specialists still comprise small teams making sure research programs run efficiently and safely.
This year’s survey included a relatively small sample of ReOps specialists (n=25), roughly half of last year’s pool. That fits with the reality that a single ReOps specialist typically supports 15–35 researchers on average.


“Being the sole Research ops person is hard on my bandwidth."
Just over a third of participants (35%) reported having ReOps at their organization, and only 12% said their company laid off ReOps in 2025.
Most ReOps teams (72%) were small, with five or fewer specialists.
Overall, there were no statistically significant changes year over year in ReOps presence, team size, or tenure.
While the dataset is too limited to draw sweeping conclusions, the trends hint at important realities.
ReOps specialists primarily support qualitative research, handling a median of 15 projects over six months, compared to 2 mixed-method and 3 quantitative studies.
Interviews (92%) and surveys (83%) are the most common methods supported by ReOps. ReOps specialists also have high comfort in usability testing and literature reviews (96%), as well as surveys and interviews (88%).
Eighty percent felt positive about the amount of time they spent on their research operations tasks as well as the time they spend supporting the research of others.
How is AI transforming Research Ops? We interviewed 21 pros about the shift from tactical to strategic work, rising governance demands, and navigating resource constraints. Read the State of Research Operations.

It might be that recruiting tools are fueling a smoother takeoff, helping researchers reach their target audiences more efficiently.
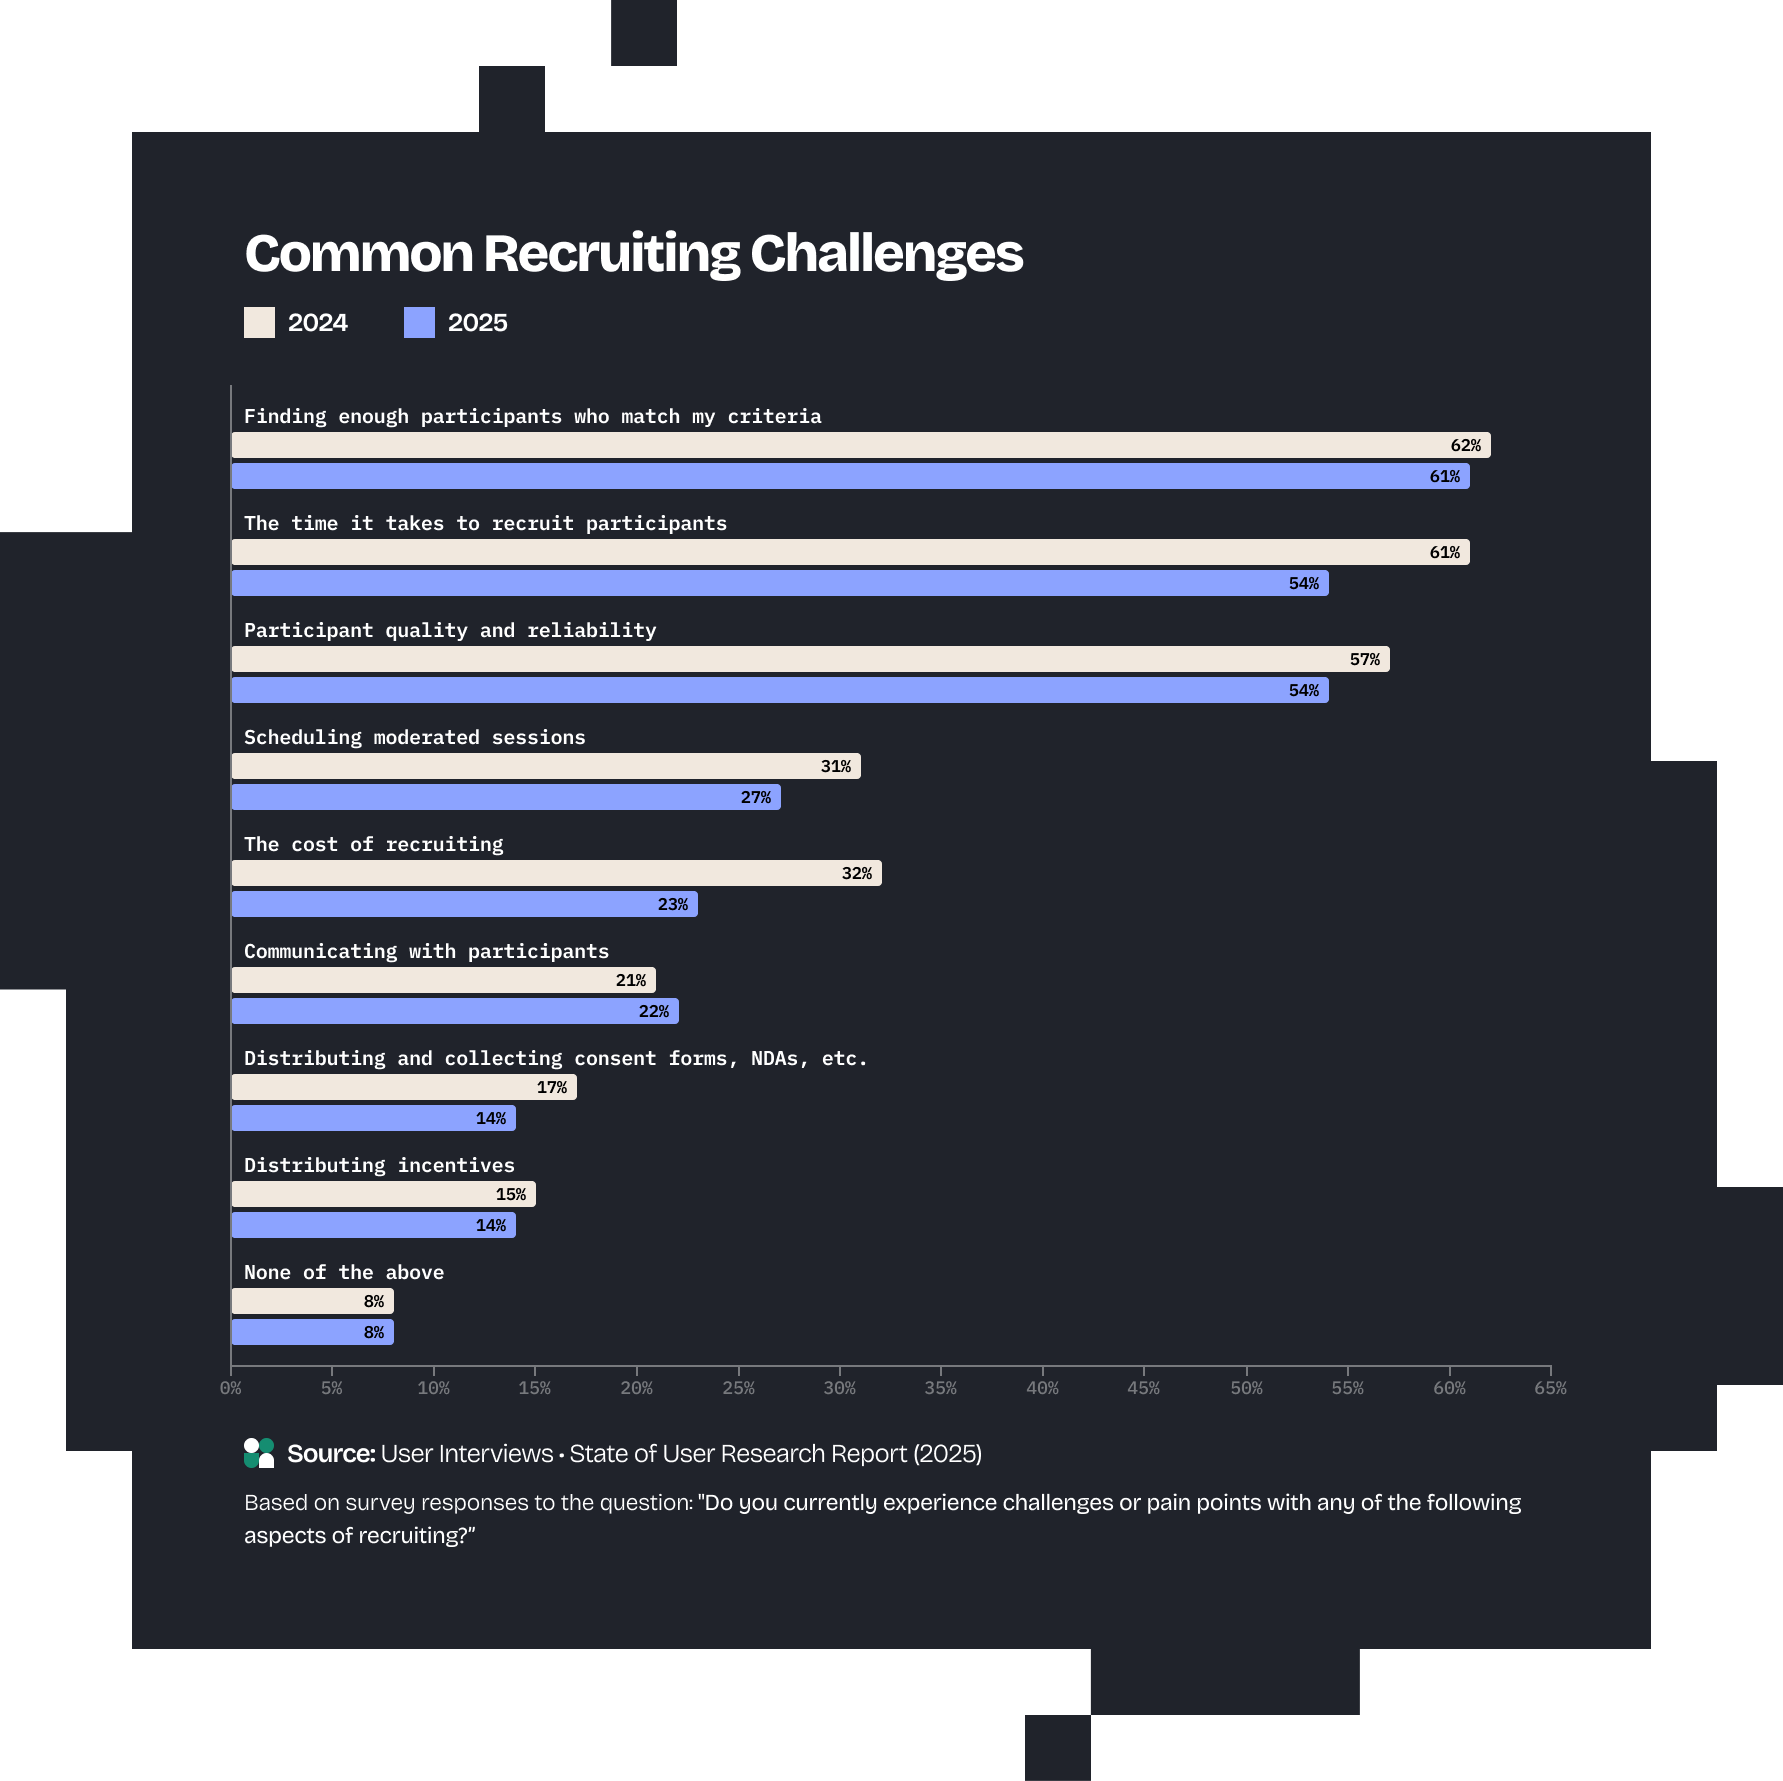
Overall, finding enough qualified participants, the time to recruit, and participant quality remain the biggest struggles. However, we did see some encouraging drops in the time it takes to recruit (-7 points to 54%) and cost concerns (-9 points to 23%) in comparison to last year.


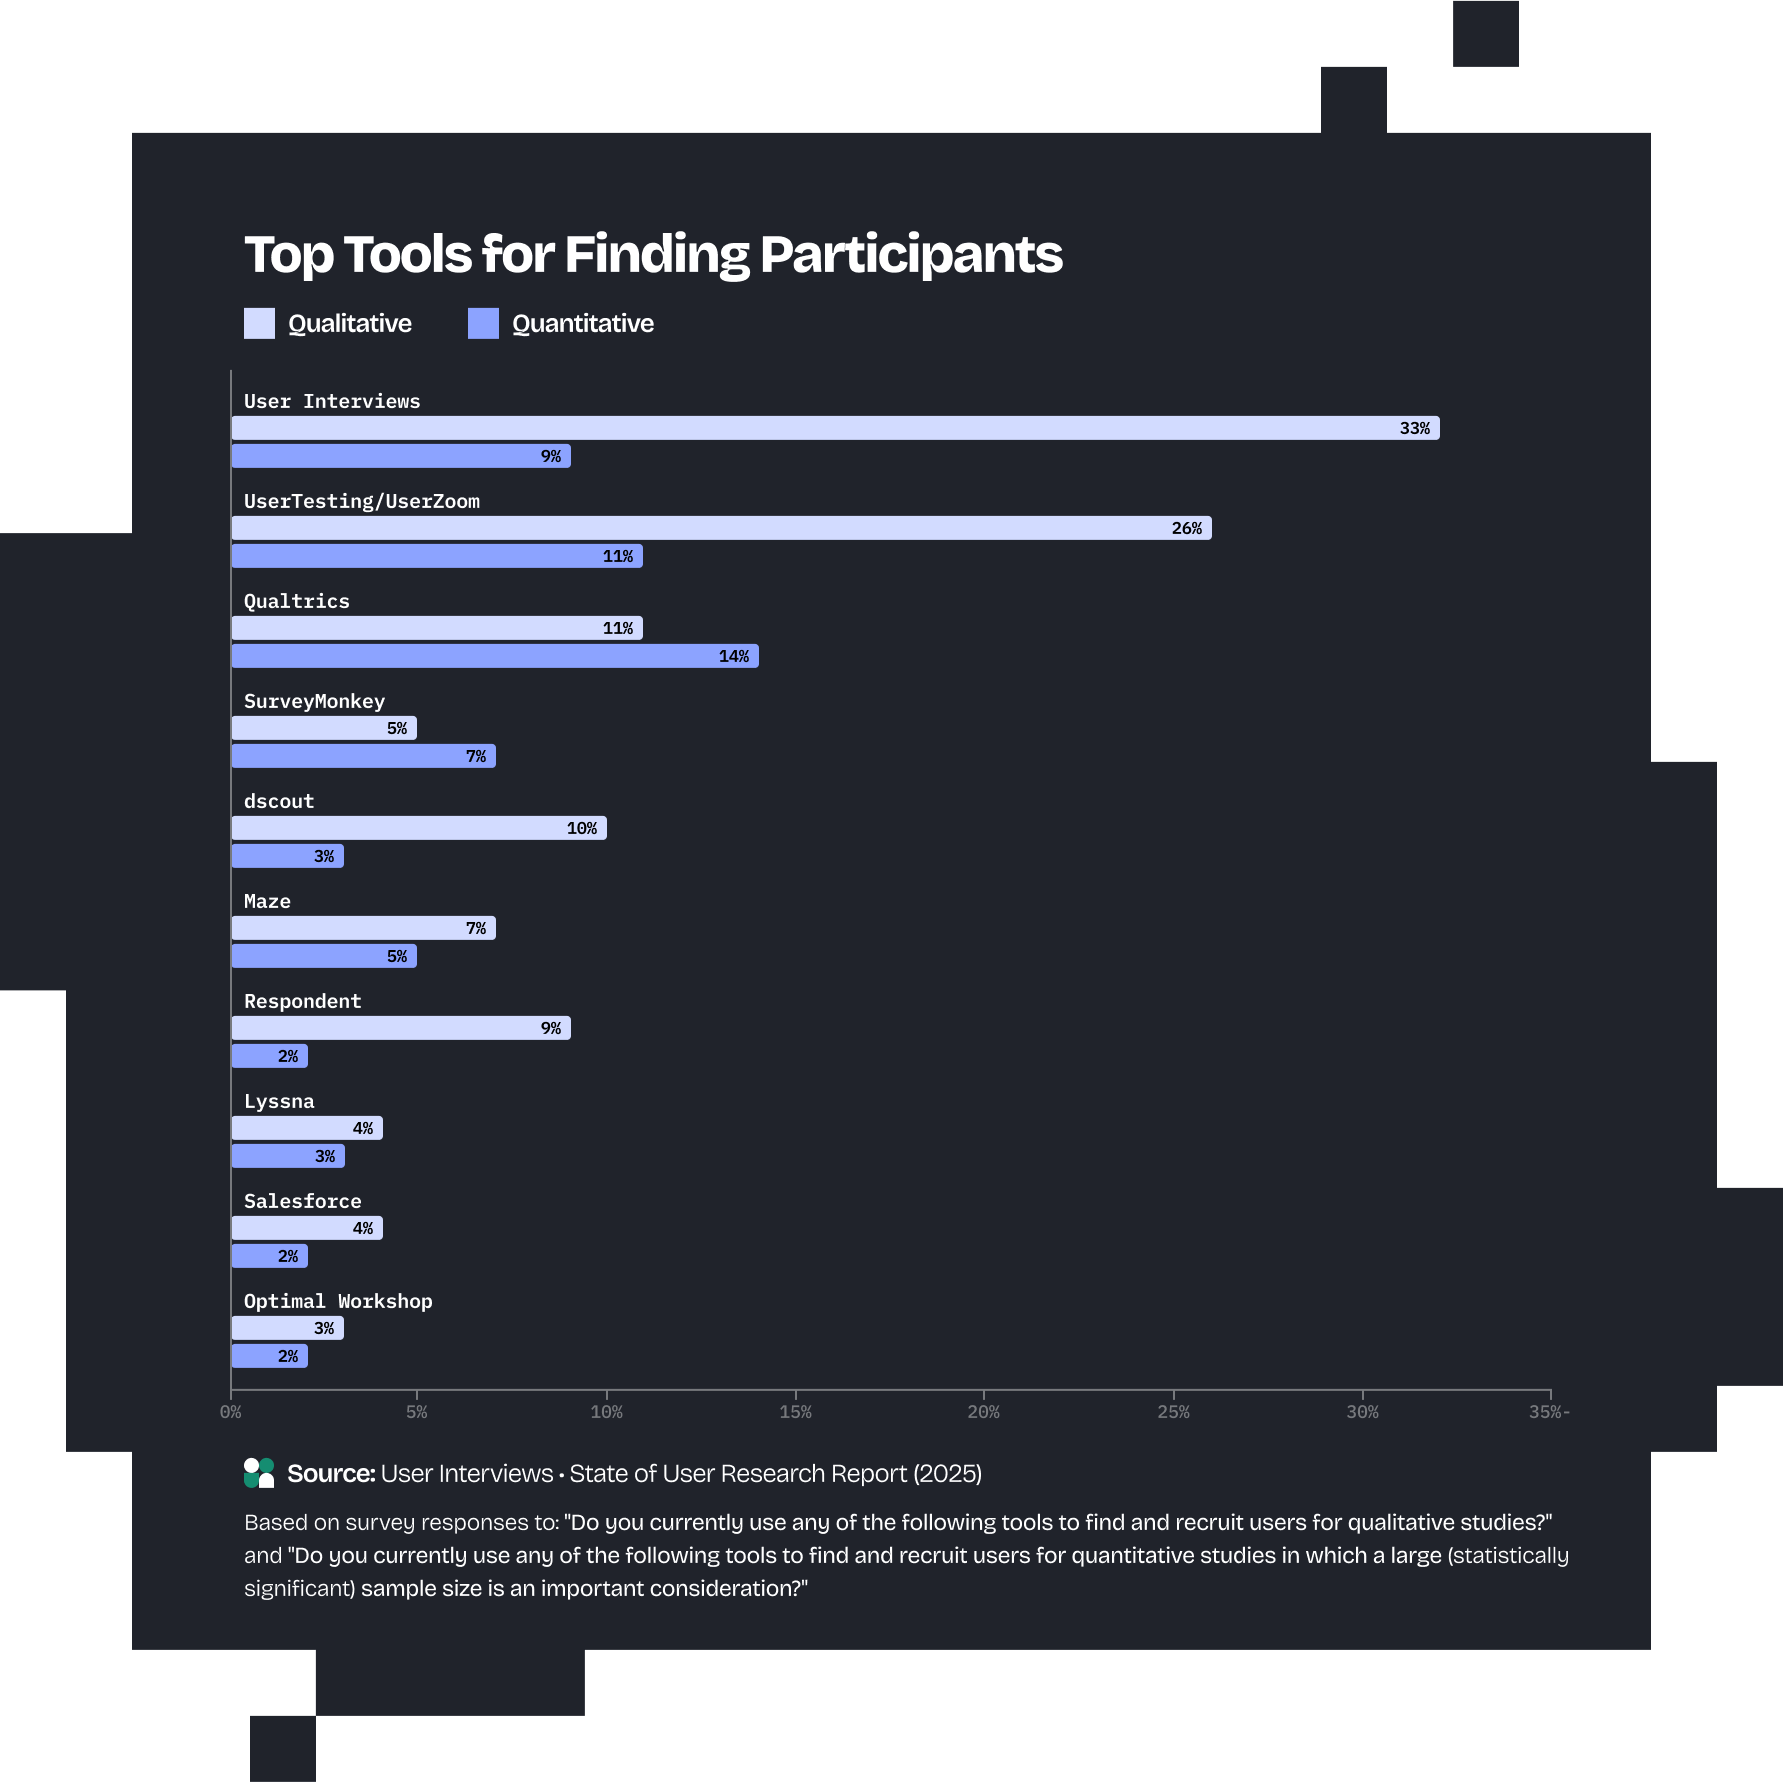
More than 70% of respondents use a tool for qualitative recruiting.
Among our audience, User Interviews is once again the most popular tool for recruiting overall, with 34% of researchers calling it their primary recruiting tool.
For quantitative recruiting, 56% rely on a tool, with Qualtrics leading the way for a primary recruiting tool (17%).
Panel management tools are also common, used by just over half of respondents, with User Interviews again topping the list in terms of primary tool (21%).
Start talking to hard-to-reach professionals and qualified consumer participants in a matter of hours, not weeks. Launch a free project to get started.
We’ll be digging deeper into research tools in a full State of User Research Tools report, complete with an updated 2025 Tools Map — stay tuned for insights on which solutions are shaping workflows, speeding recruiting, and helping researchers do their best work.

So what is the state of user research for 2025? Our data suggests it looks stable from 30,000 feet—but there’s still so much to discover on how that story changes based on key demographics such as industry, seniority, company size, geography, strategy, and more.
Needless to say, there is no "average" researcher, and we're excited to surface more insights on how research identity, craft, strategy, salary, tools, and support have changed for different researcher segments.
Check back here for expert-driven advice on how to use these findings in the real world, whether that's continuing to expand your horizons as a researcher or weathering the more turbulent times, along with qualitative data from the actual researchers who are building the plane while flying it each day.
(Can’t wait? Get a copy of the State of User Research 2025 dataset so you can dive into the data yourself!)

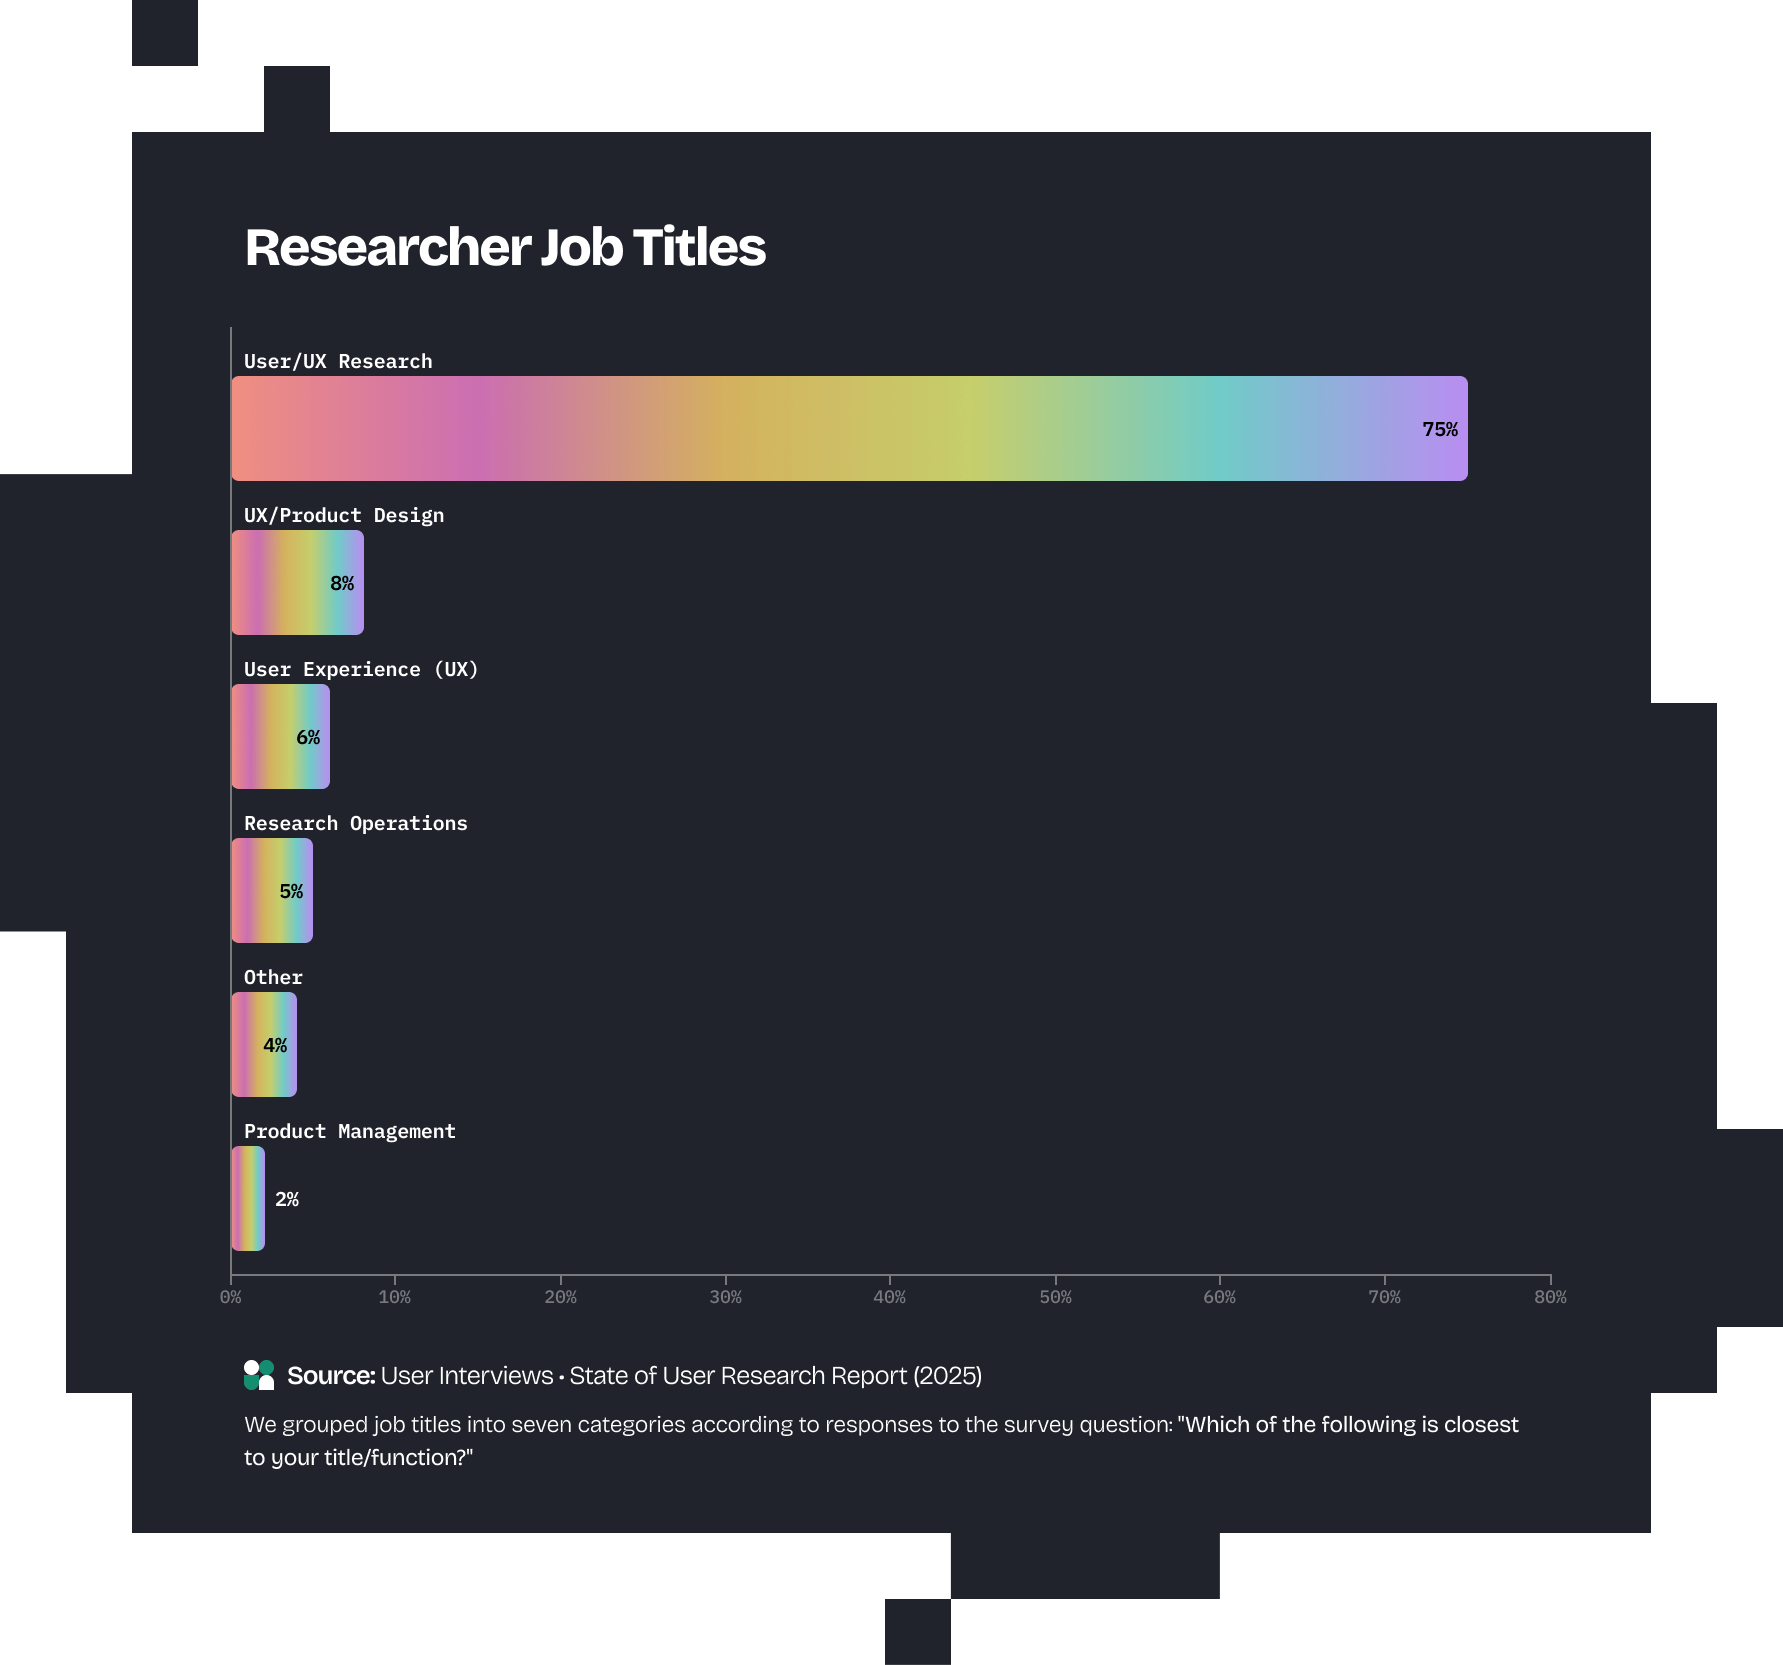
Researchers
With a capital “R,” people whose titles include UX/Product/Design/User Research, or similar terms. Also called “dedicated Researchers.”
researchers
With a lowercase “r,” a catchall term for people who do or support research at least some of the time (a.k.a. all our survey participants).
ReOps
People whose titles include Research Operations (Ops) or similar terms.
Research specialists
Collective term for dedicated Researchers and ReOps professionals.
research teams
When written with a lower-case “r,” research teams refers to everyone involved in research at an organization, whether or not they report to a Research department.
The 2025 State of User Research survey was conducted by Liz Steelman and Morgan Koufos. Analysis was carried out in Google Sheets and Mode with the support of Maria Kamynina and Jessica Hays Fisher.
This report was written by Liz Steelman, with contributions from Morgan Koufos and Nick Lioudis. The webpage was designed and built in Webflow by Holly Holden with graphic support by Jane Izmailova.
From July 25 to August 9, 2025, we collected 485 qualified responses via social media, our weekly newsletter (Fresh Views), and an in-product slideout; we posted the survey in research-related groups on LinkedIn and Slack; and members of our team and friends within the UX research community shared the survey with their own professional networks.
We are extremely grateful to our partners and everyone from the UXR community who shared the survey and contributed to the success of this report. Special thanks to Cha Cha Club and UXArmy!
Above all, we are indebted to the participants who took part in our survey. Thanks again!
PUBLISHED: September 10, 2025
UserTesting enables organizations to craft exceptional customer experiences through fast, actionable human insights. With the world’s strongest participant network, AI-powered analysis, expert services, and seamless integrations, we help teams validate ideas, optimize experiences, and build products that drive measurable business outcomes. As the leader in human insights, UserTesting empowers teams to co-innovate at scale and embed customer feedback into every stage—from ideation to launch—eliminating guesswork and aligning stakeholders. Trusted by 3,000+ customers, including 75 of the Fortune 100, UserTesting delivers an average 4—6x ROI, depending on size and scale of deployment. Helping companies make smarter decisions, reduce costs, and exceed customer expectations.
PUBLISHED: September 10, 2025


.png)

Schedule your demo and see us in action today.