Research teams face a tension between sustainable practices and immediate results, and researchers often find themselves without the systems to succeed at either, according to our new analysis of strategy trends and themes from our The State of User Research 2025 survey of 485 researchers across the globe.
Read below to see how the directives, structures, and methods that businesses use to achieve their research goals changes according to team structure and composition, maturity trajectory, operational infrastructure, and organizational pressure. You can also view the implications for teams and download our recommendations based on team tenure.
Don’t want to get bogged down in the data? Skip ahead to what it all means for you.
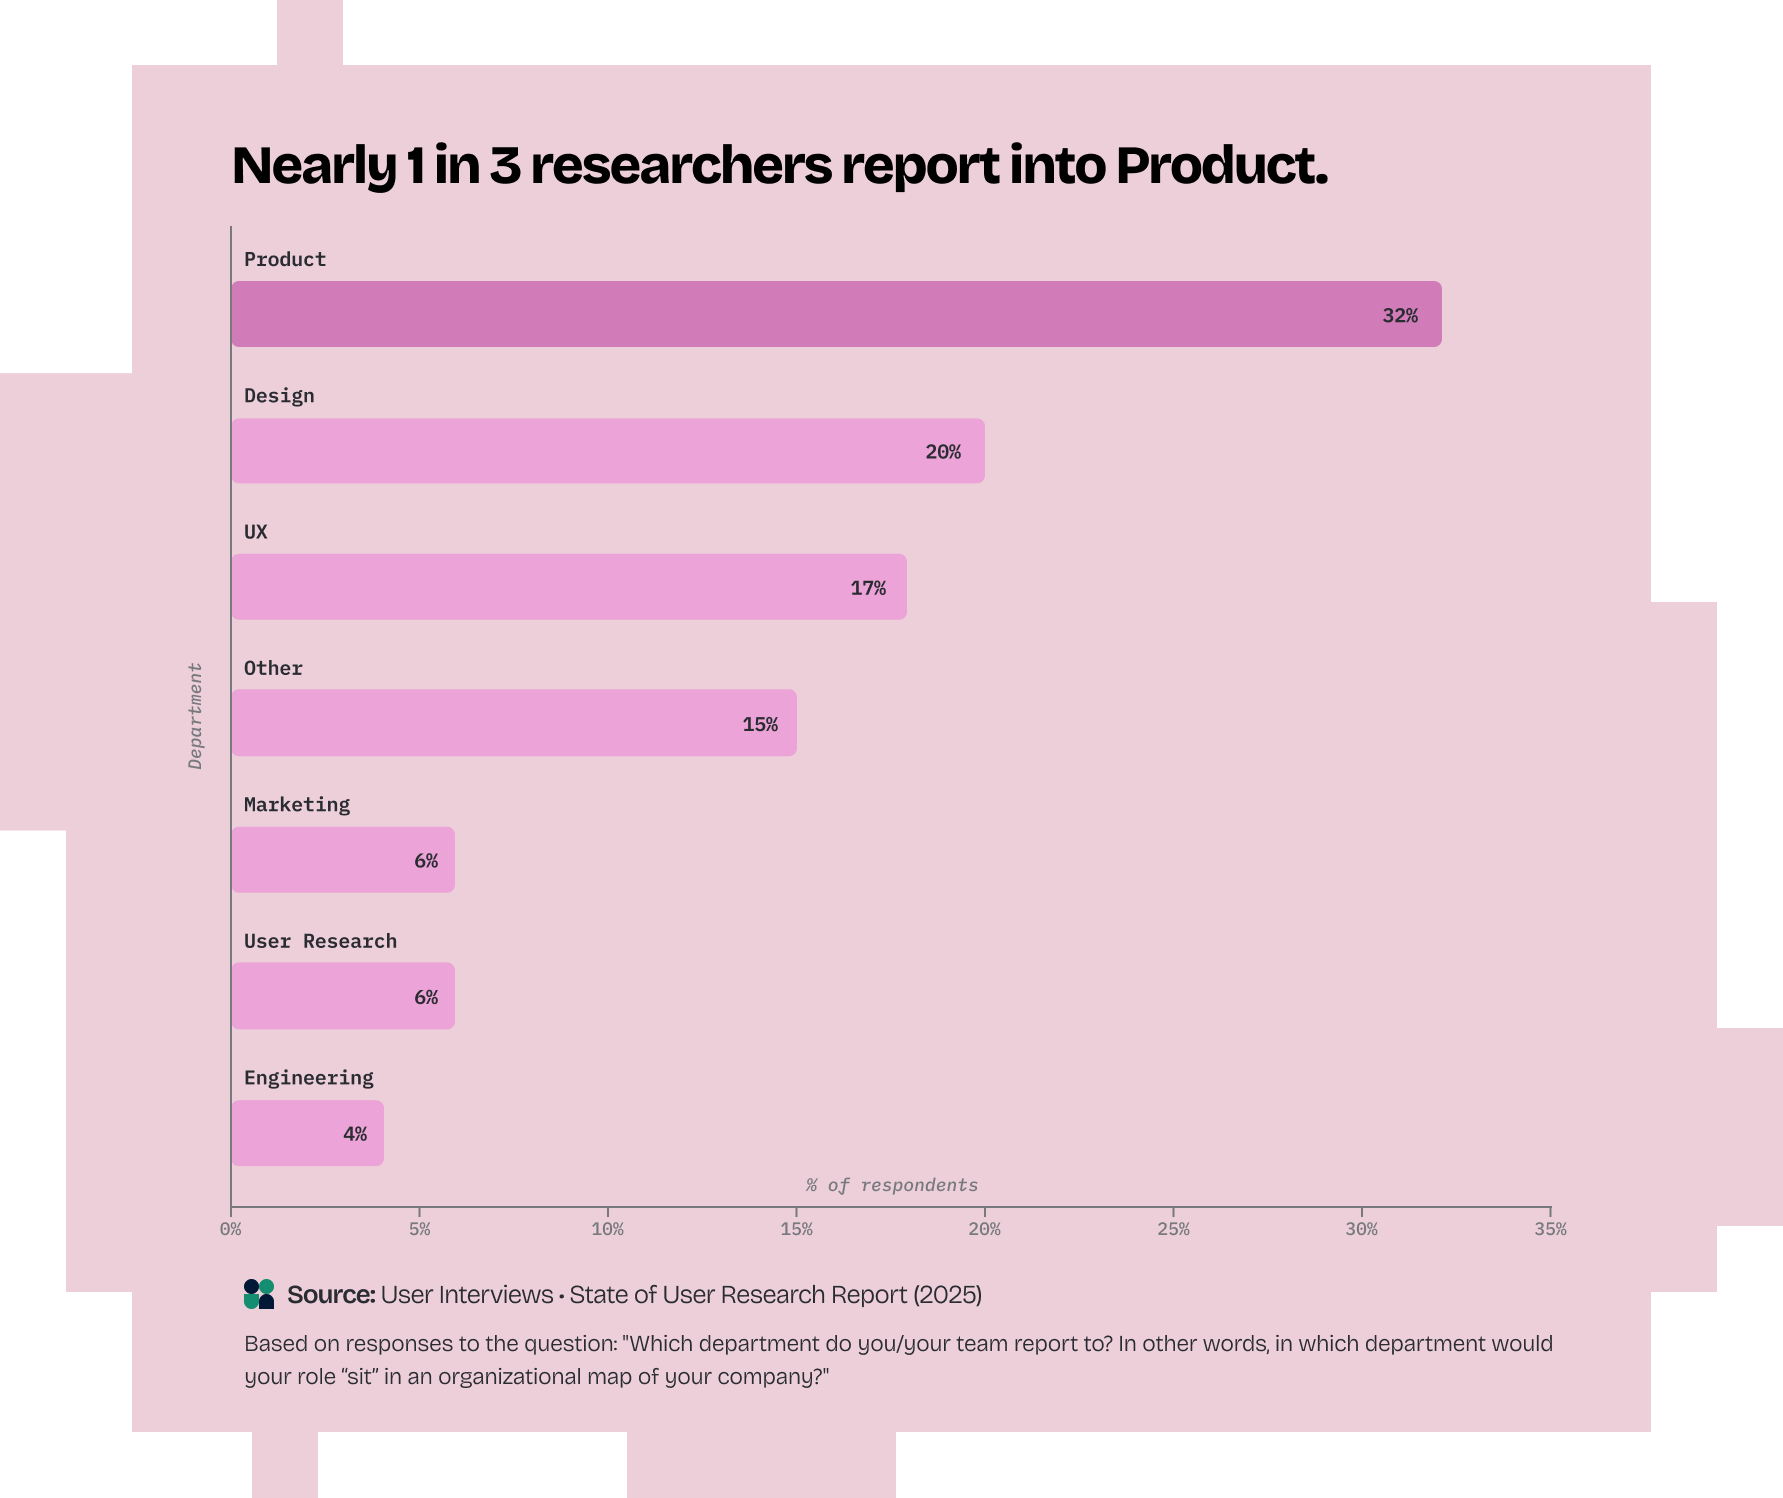
Only 6% of researchers said they sit on dedicated User Research teams. Instead, research is distributed across functions, with nearly one-third of respondents saying they report into Product.
Read more →There’s no single optimal team size that signifies teams are mature. Rather, teams evolve through different stages, with researchers on teams with 6+ years of sustained investment doing more rigorous, impactful research.
Read more →Organizations invest in scaling research but chronically underinvest in satisfactory measurement infrastructure and Research Operations—creating a ceiling on effectiveness.
Read more →Peer and leadership support has remained flat year-over-year. But at organizations that laid-off dedicated Researchers, only 40% reported positive leadership buy-in—compared with 62% in teams without layoffs.
Read more →

Research has achieved scale: Eighty-seven percent of survey respondents report having dedicated Researchers (UXRs) at their companies.
But research remains functionally embedded: Standalone Research departments are scarce (6%). Nearly one-third of researchers report into Product—the plurality. Another significant portion sits within Design or UX.
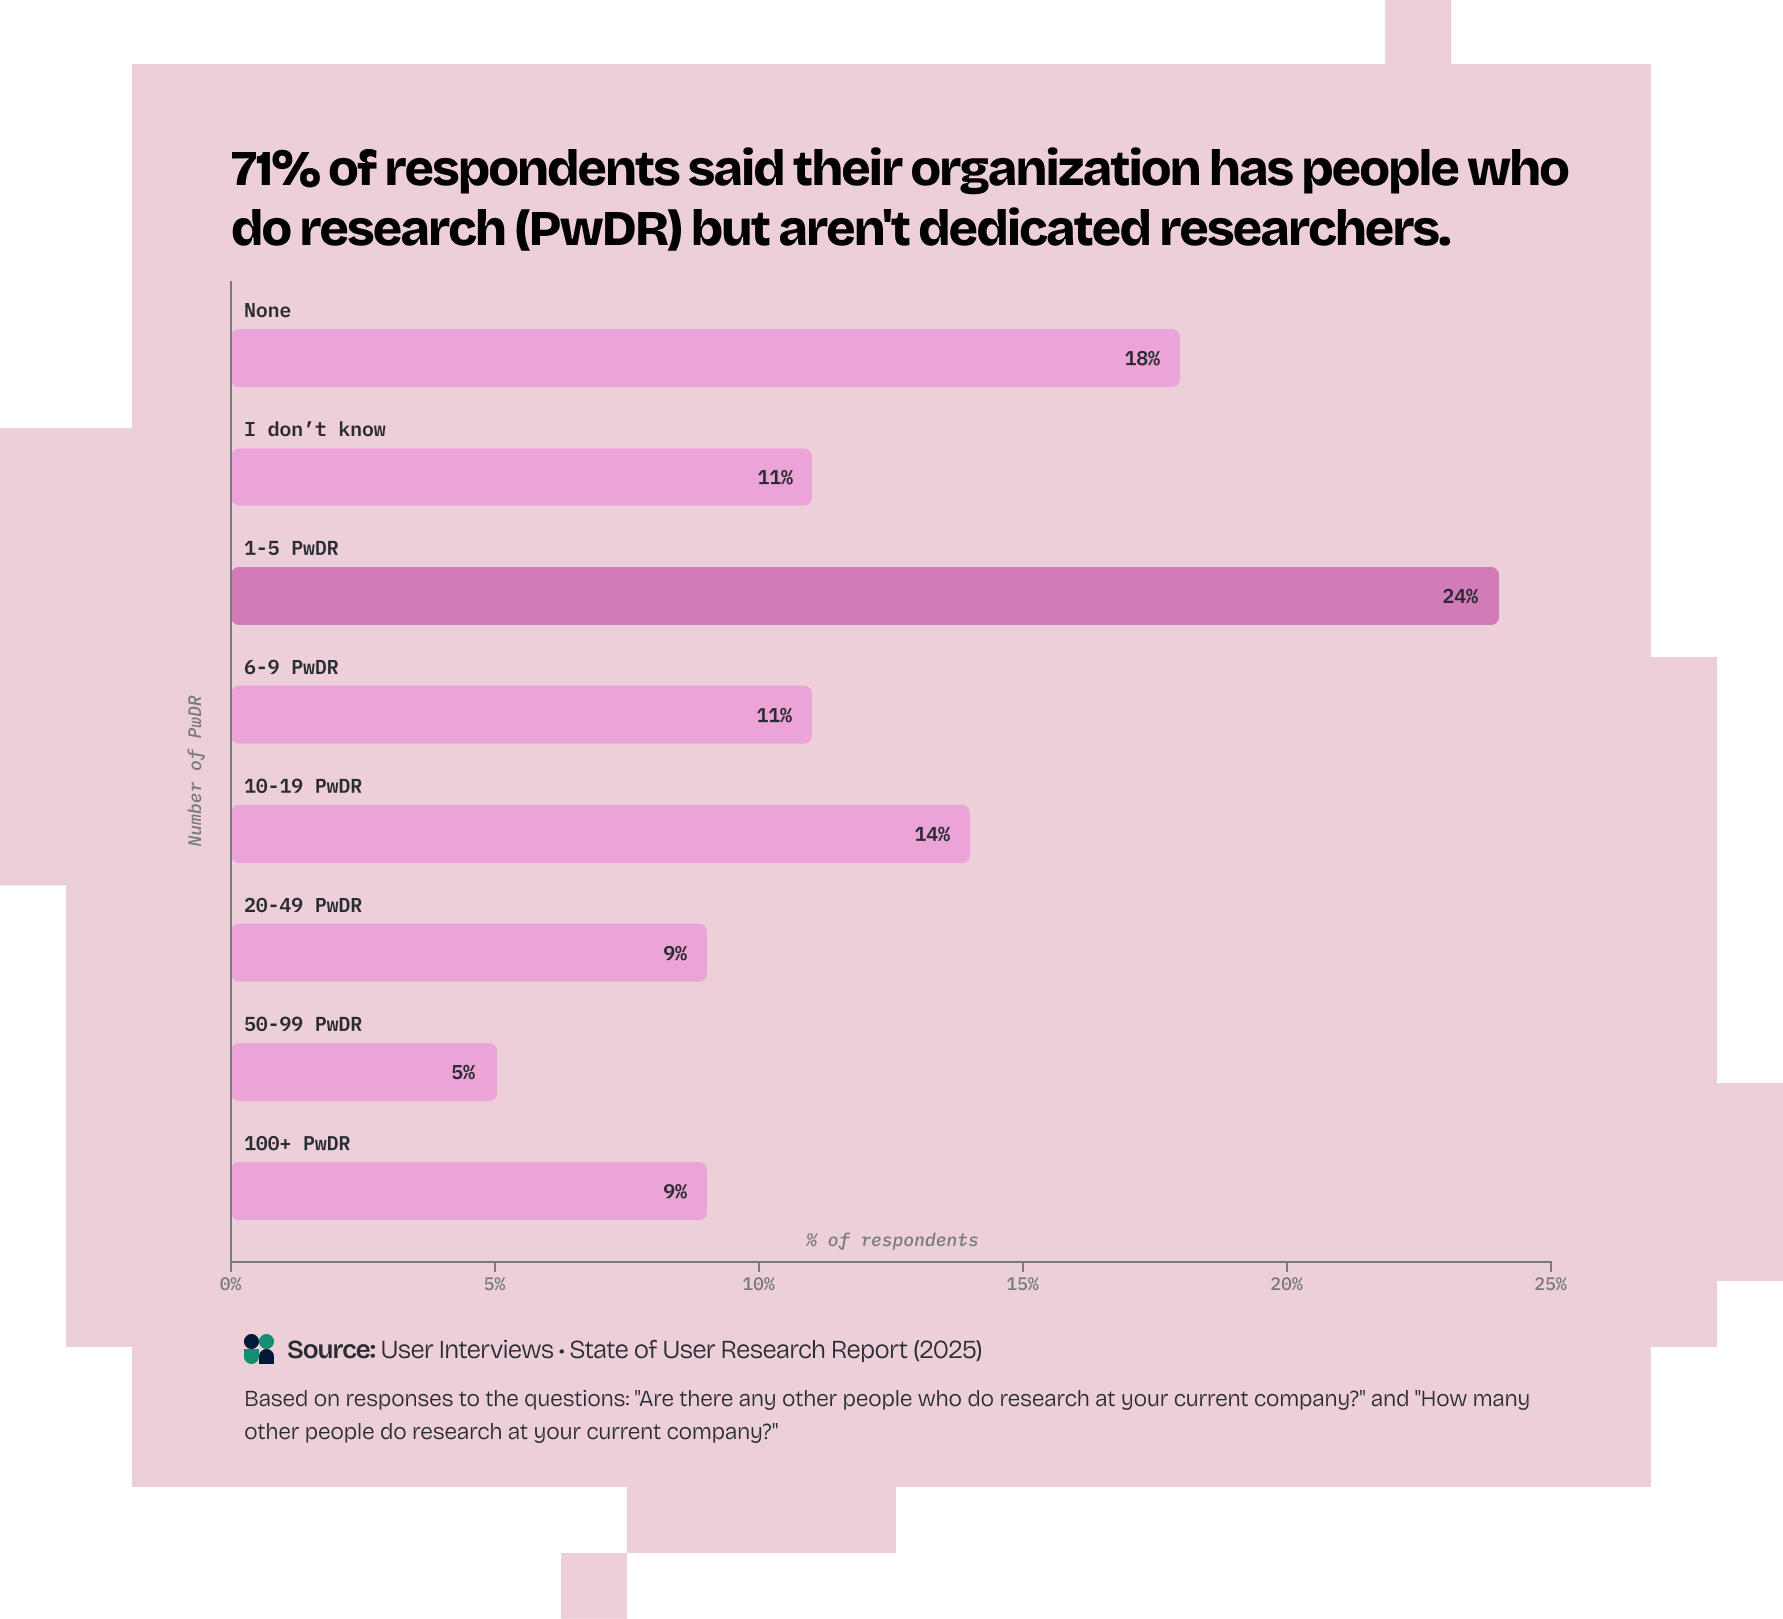
Democratization expands alongside dedicated Researchers: Seventy-one percent of respondents said their organization has people who do research (PwDR) but aren't dedicated Researchers. Of those who have a PwDR presence, about half of respondents (48%) said that they have fewer than 10 PwDR at their company and one third said they have more than 20 PwDR.
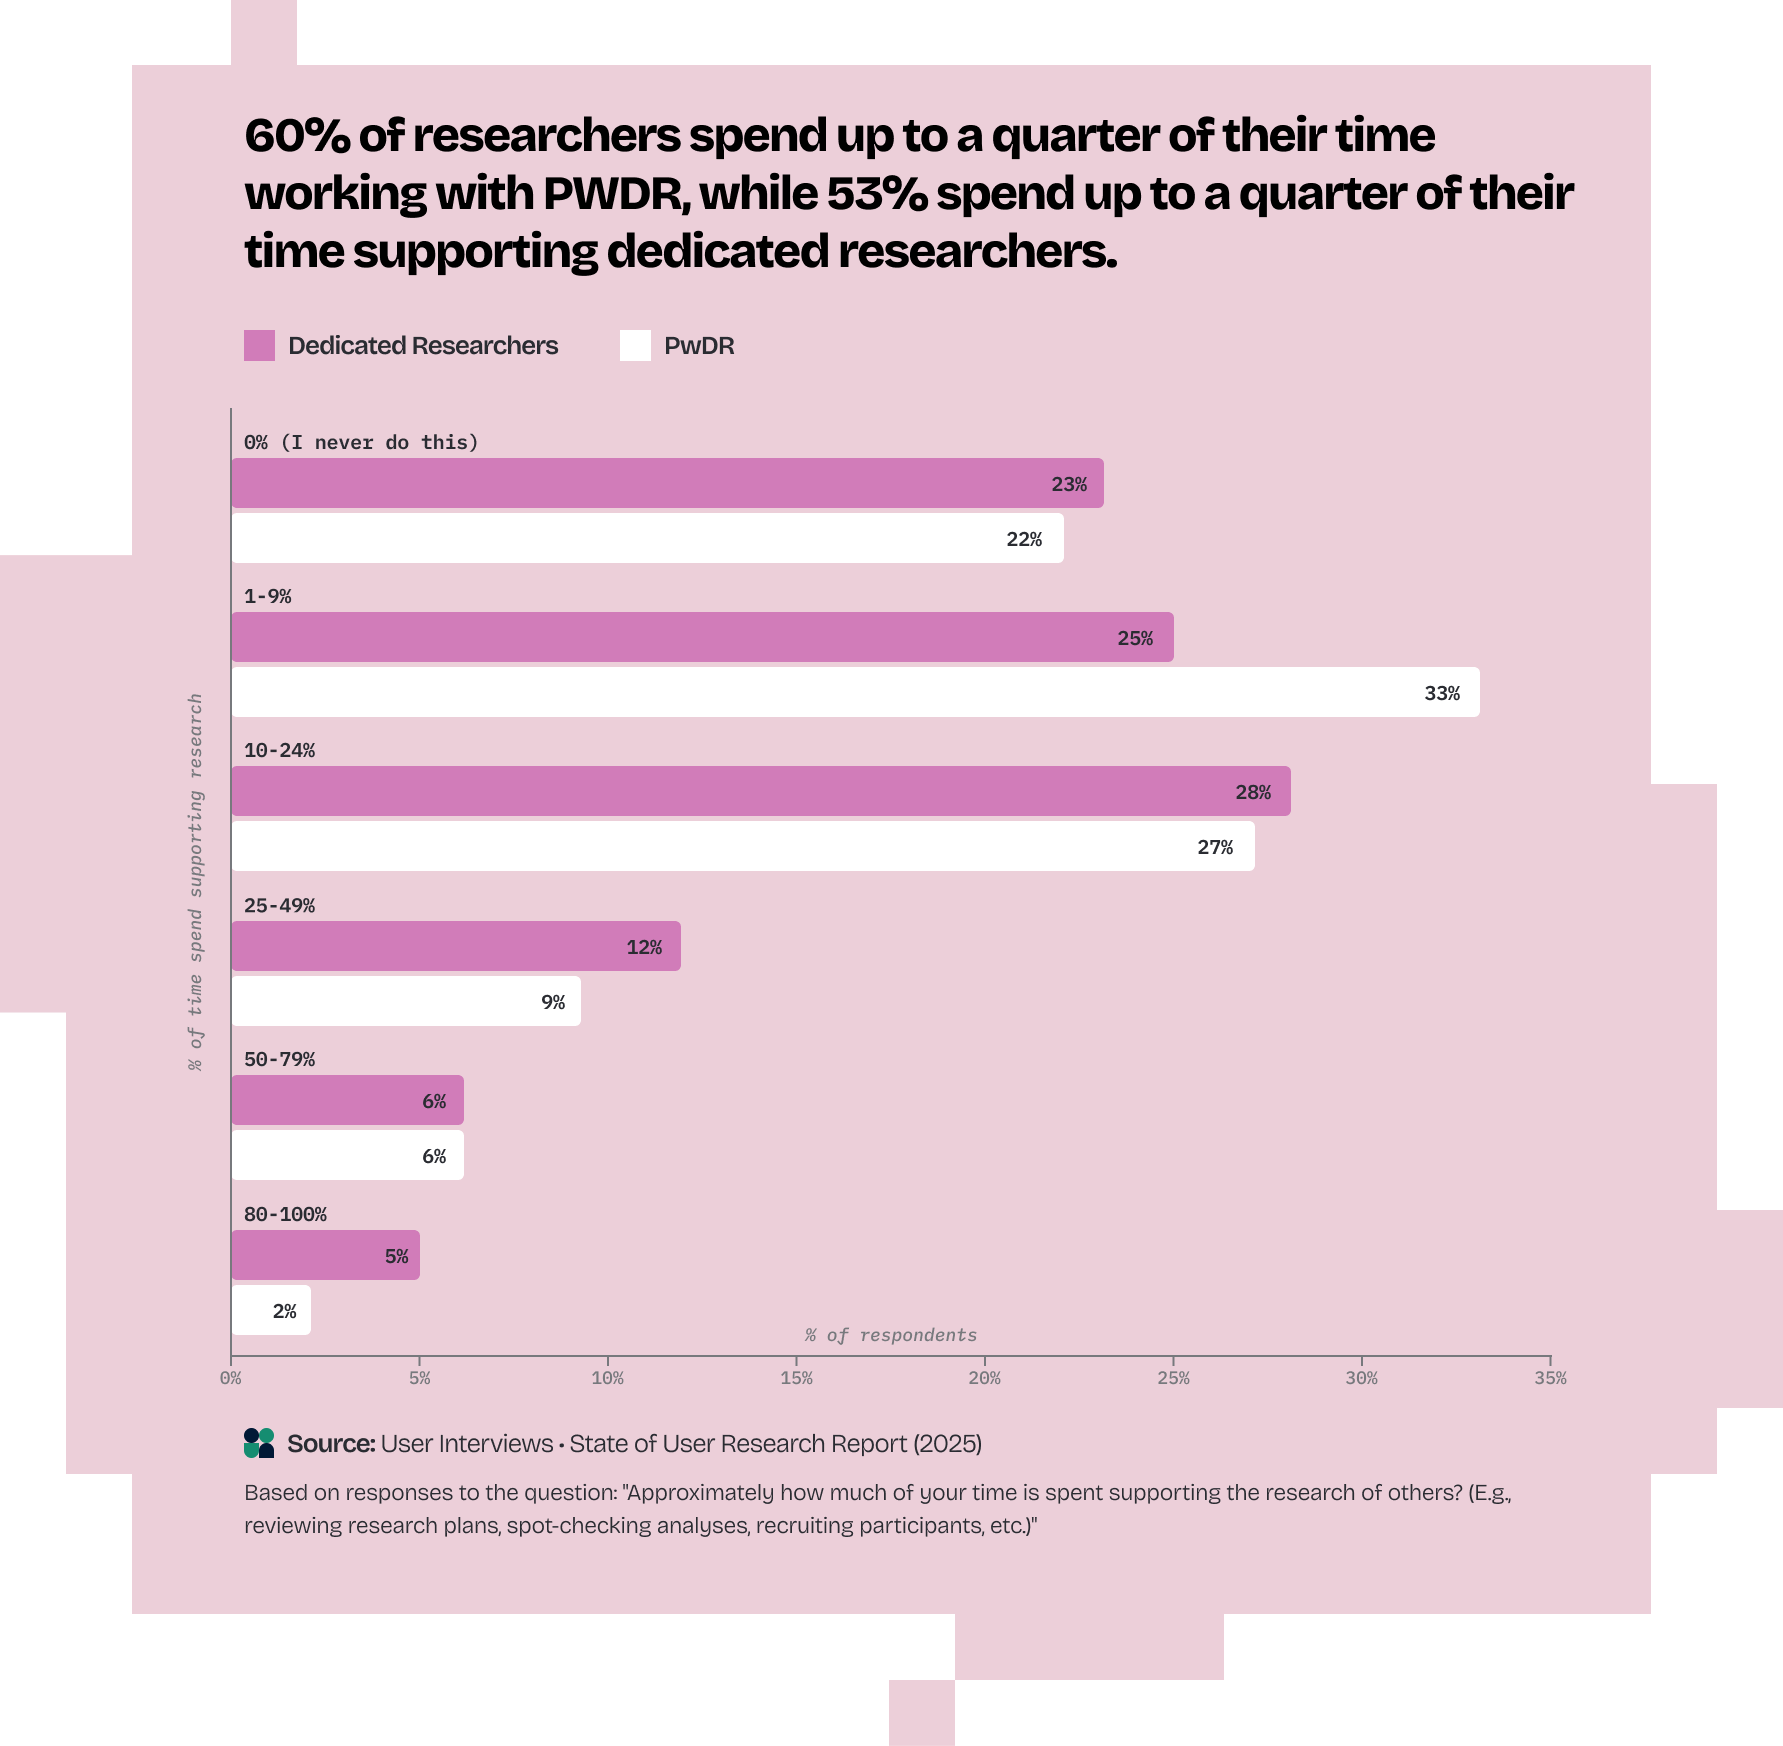
Supporting research consumes significant time: One third of researchers (including ReOps professionals) spend up to 9% of their time supporting PwDR, and 53% spend up to a quarter of their time supporting dedicated Researchers.

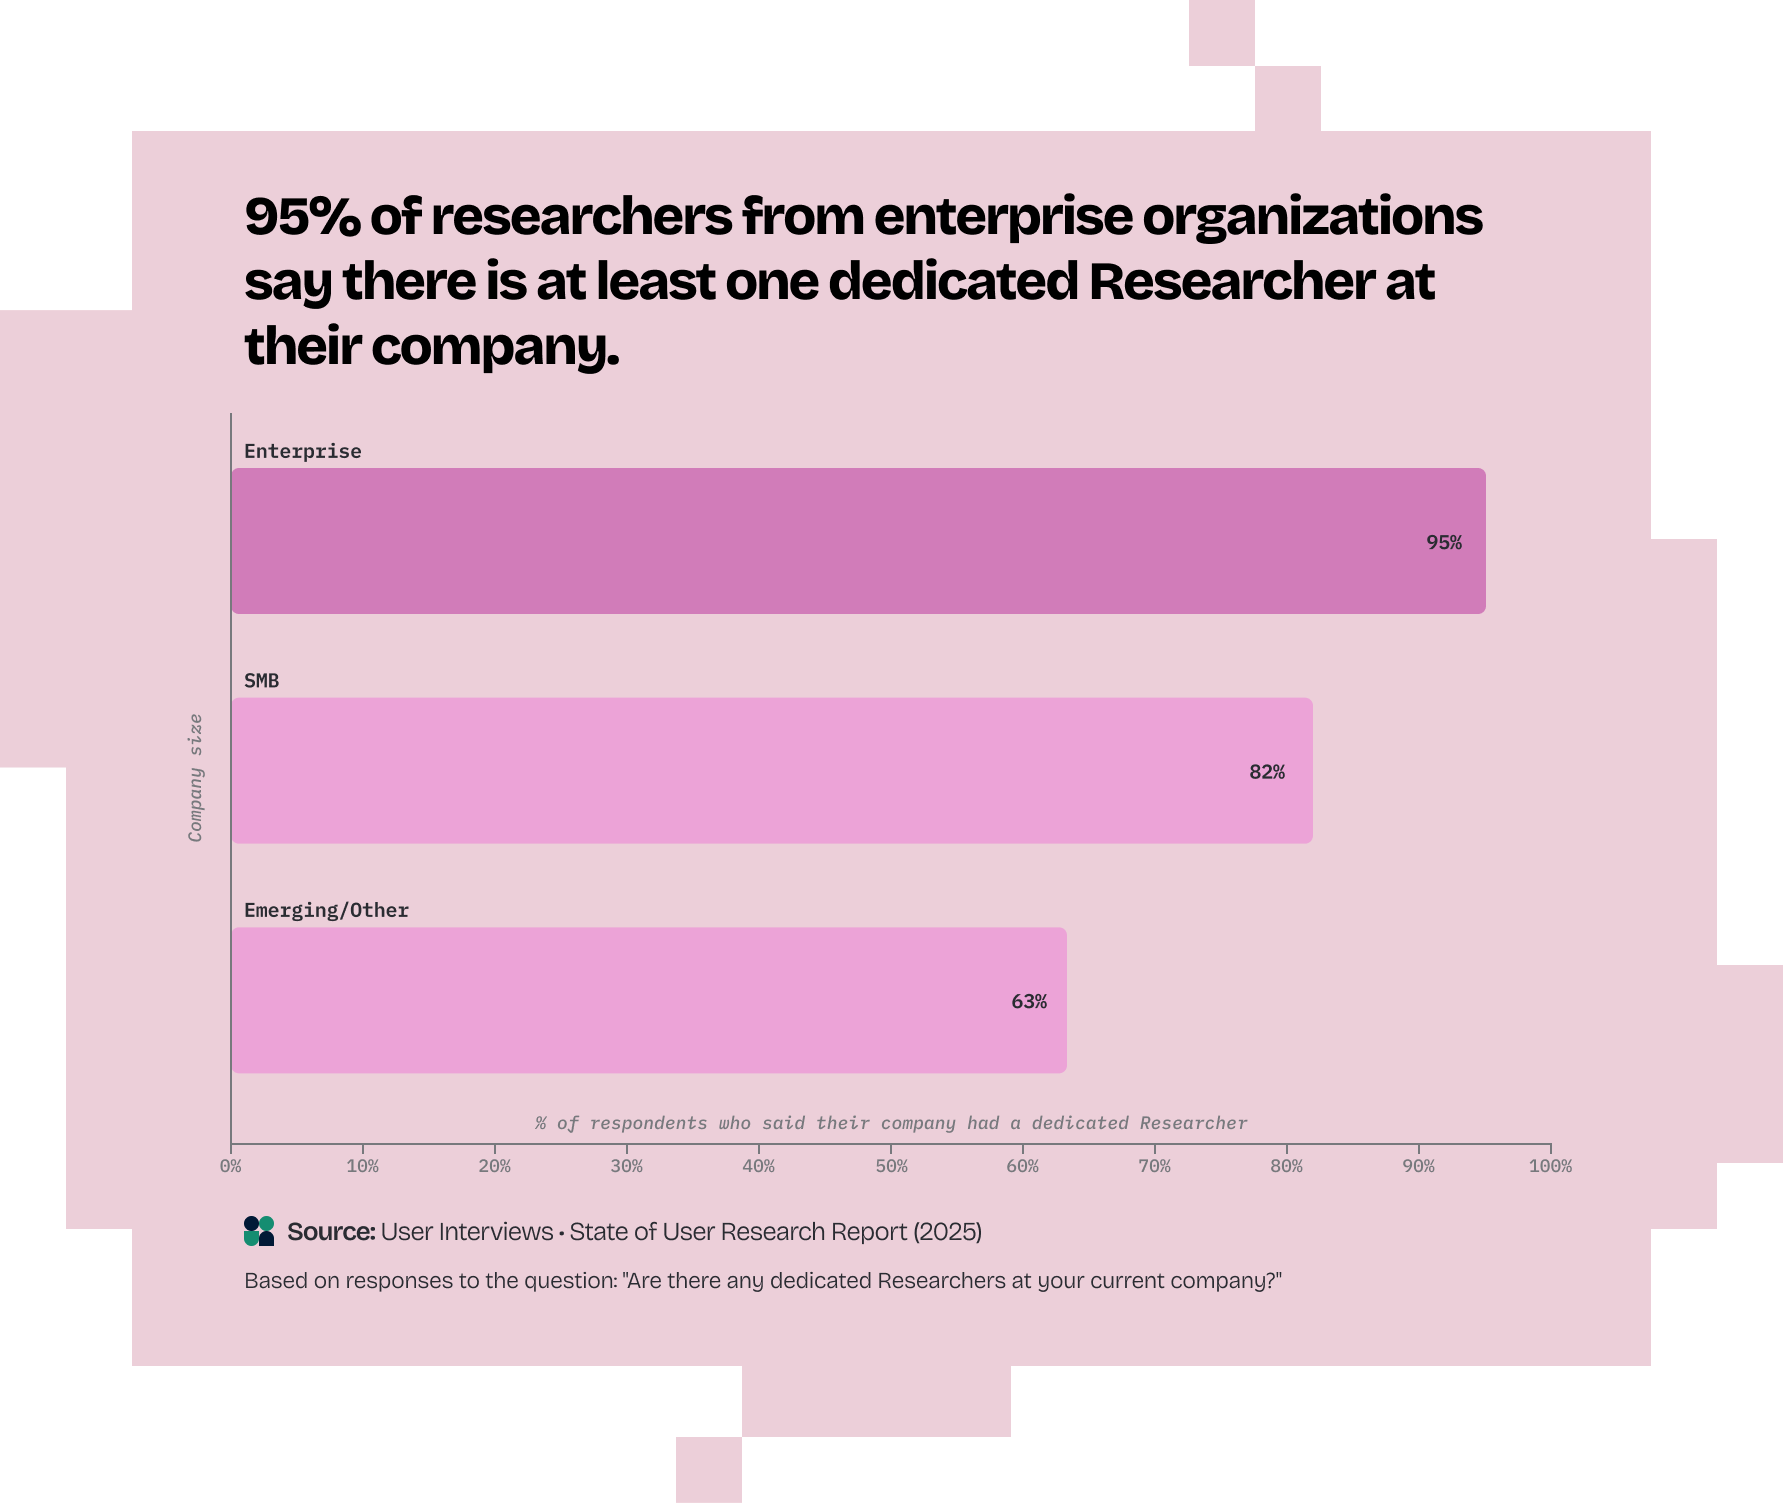
Ninety-five percent of researchers from enterprise organizations (>1000 employees) say there is at least one dedicated Researcher at their company.
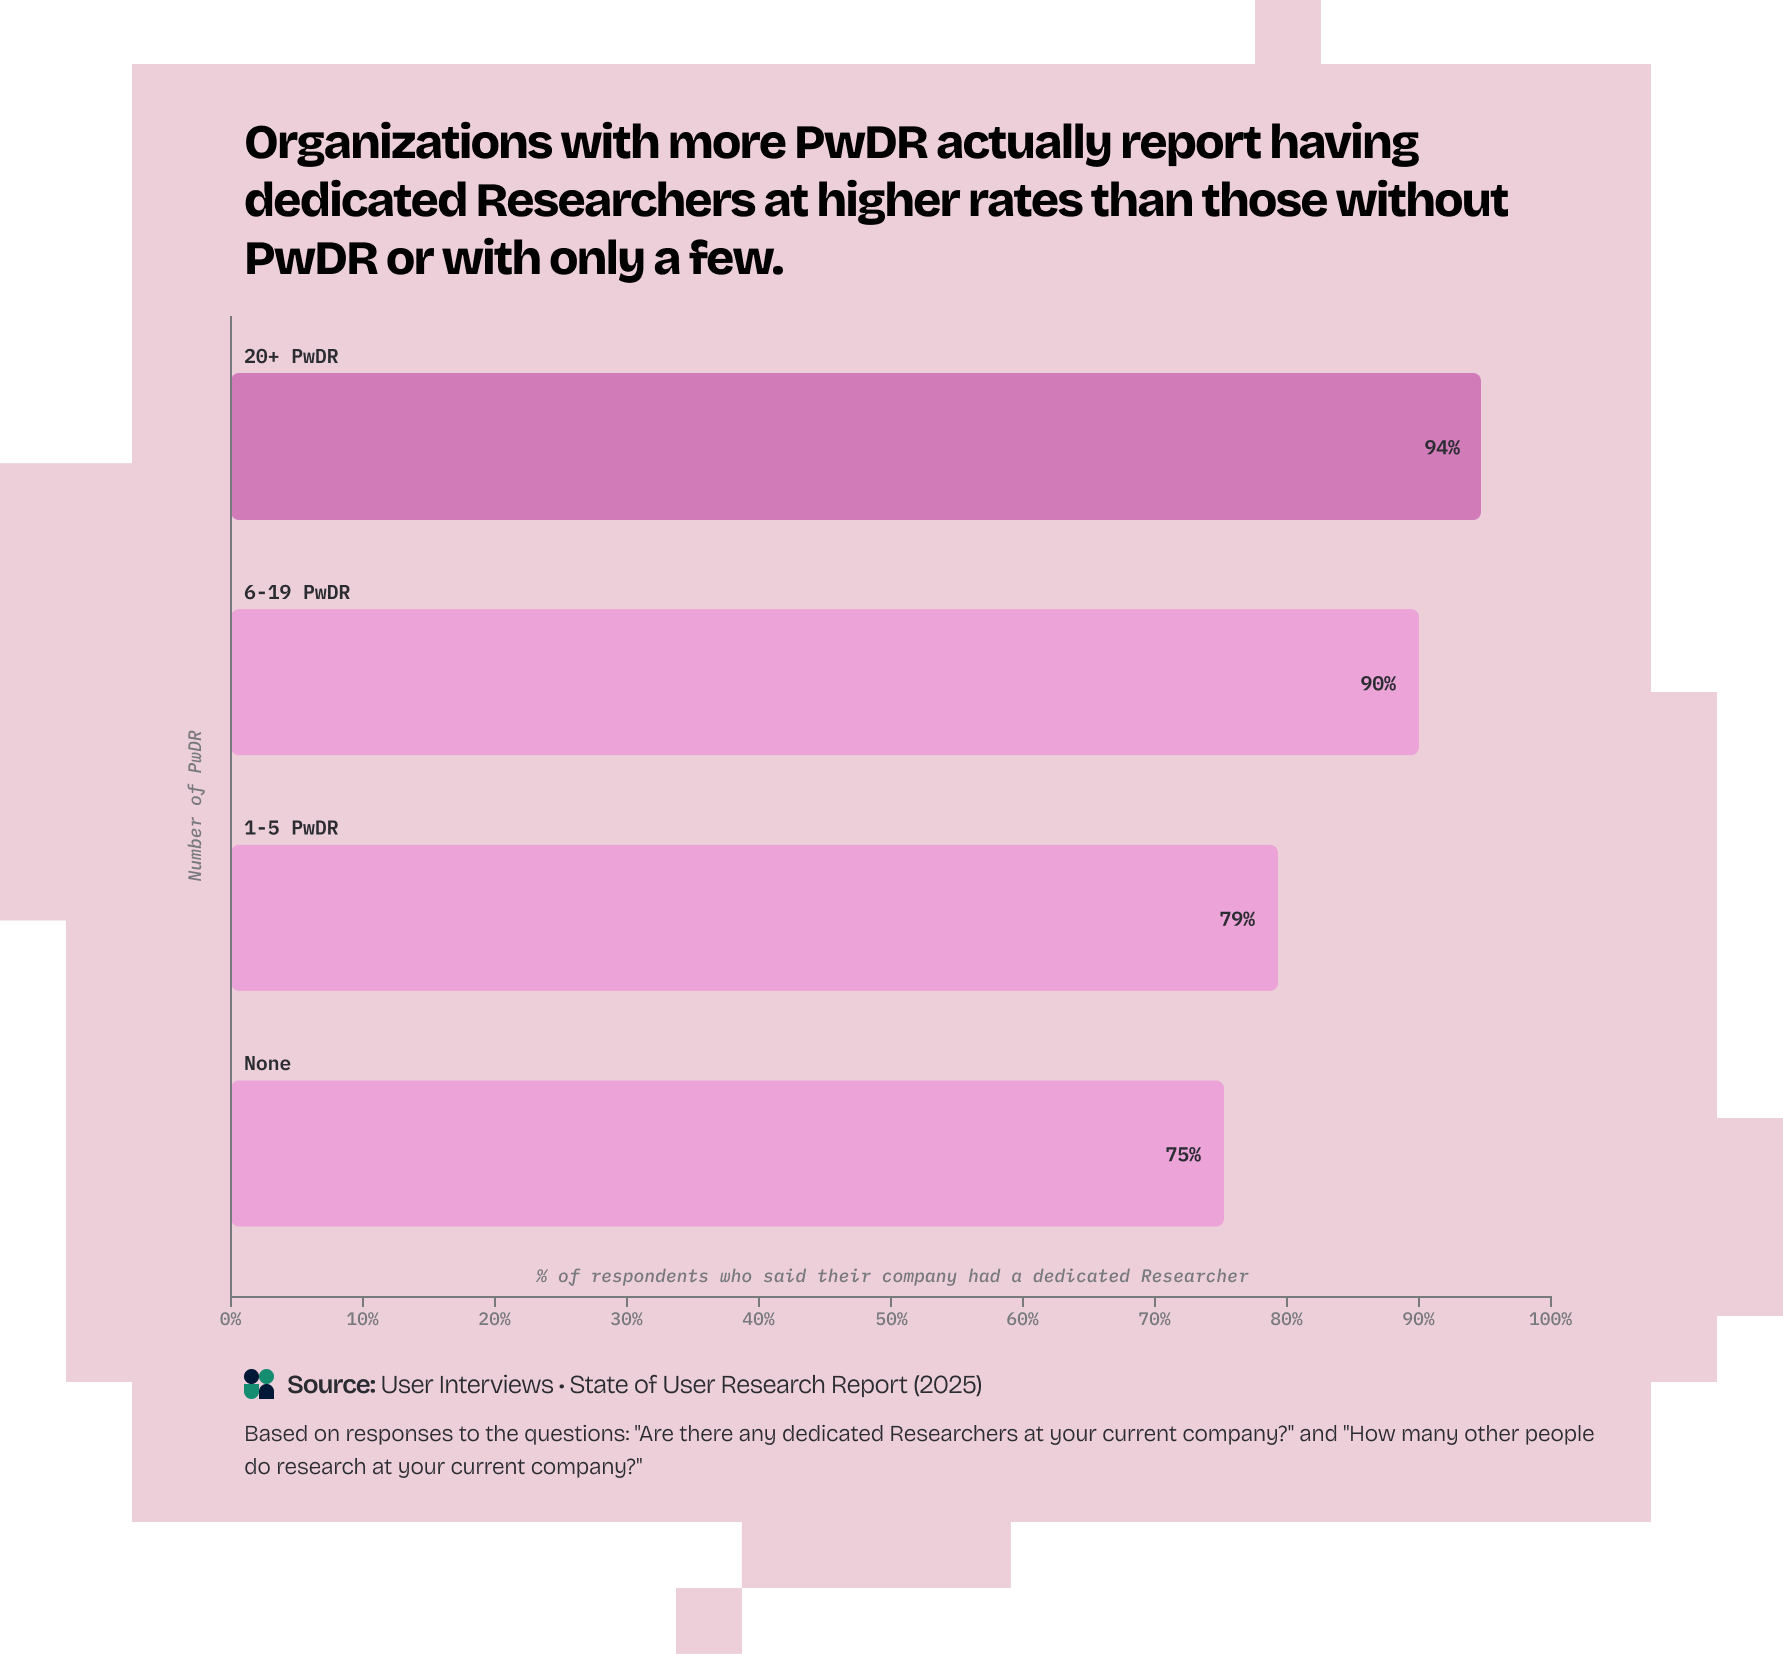
Organizations with more PwDR actually report having dedicated Researchers at higher rates than those without PwDR or with only a few.
Larger companies lead democratization. 98% of respondents with 100+ PwDR at their organization were from enterprise companies, and only 9% of enterprise respondents said they lack PwDR.
Our analysis also found that 33% of respondents at companies with under 1,000 employees never support dedicated Researchers, compared to just 14% at enterprises. Breaking down further:
Research has scaled across organizations of all sizes, yet remains an embedded function (aka ultimately reports to Product or Design) rather than an independent discipline (reports into Research). While integrating with Product and Design means researchers can enhance these functions, it may also explain why Research struggles to secure executive-level advocates (more on that below).
The democratization data challenges a common assumption: rather than replacing dedicated Researchers, PwDR are gathering insights alongside them. This suggests democratization may create demand for dedicated Researchers who can guide PwDR, maintain standards, and tackle more complex strategic questions.
However, this dynamic creates a “democratization tax.” When tenured researchers spend a quarter of their time coaching others, they can take on fewer strategic research initiatives. Organizations must weigh the value of democratization against diluting expert researchers’ focus.
This embedded structure also creates a ceiling: Research can influence the functions it’s embedded in, but struggles to shape broader organizational strategy. The support burden further constrains strategic capacity, yet organizations continue to democratize research without addressing this fundamental constraint.

Spending too much time supporting others? User Interviews helps you find and manage quality participants faster, freeing up time for more strategic work.
Book a demo
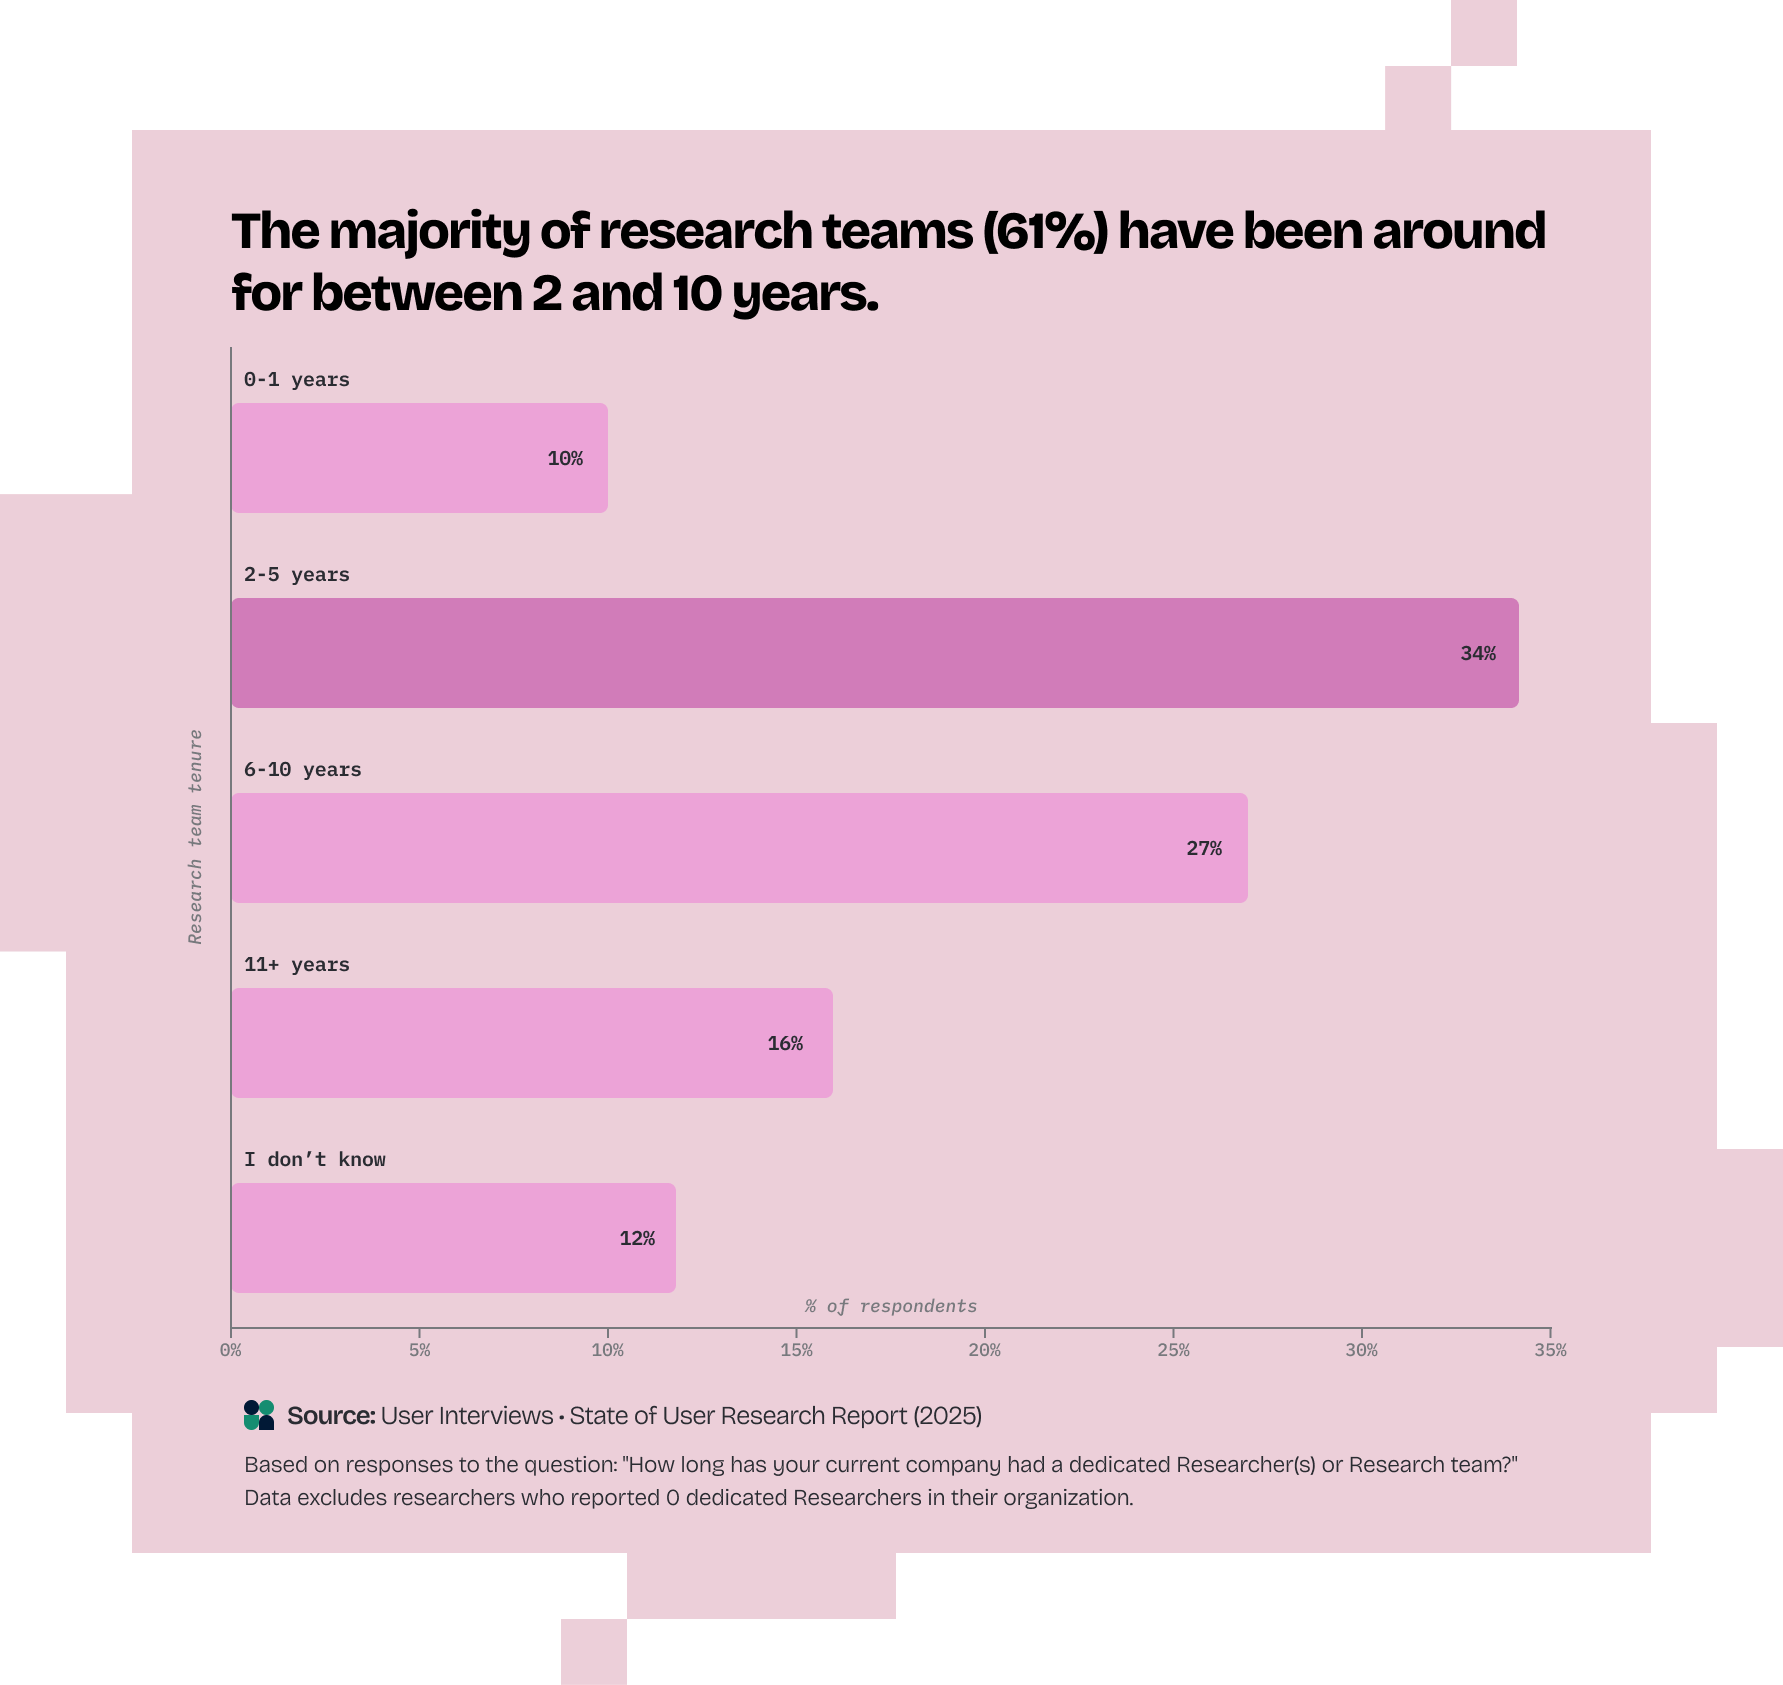
Most teams are mid-stage: The majority of respondents (61%) say their research team has been around for between 2 and 10 years.
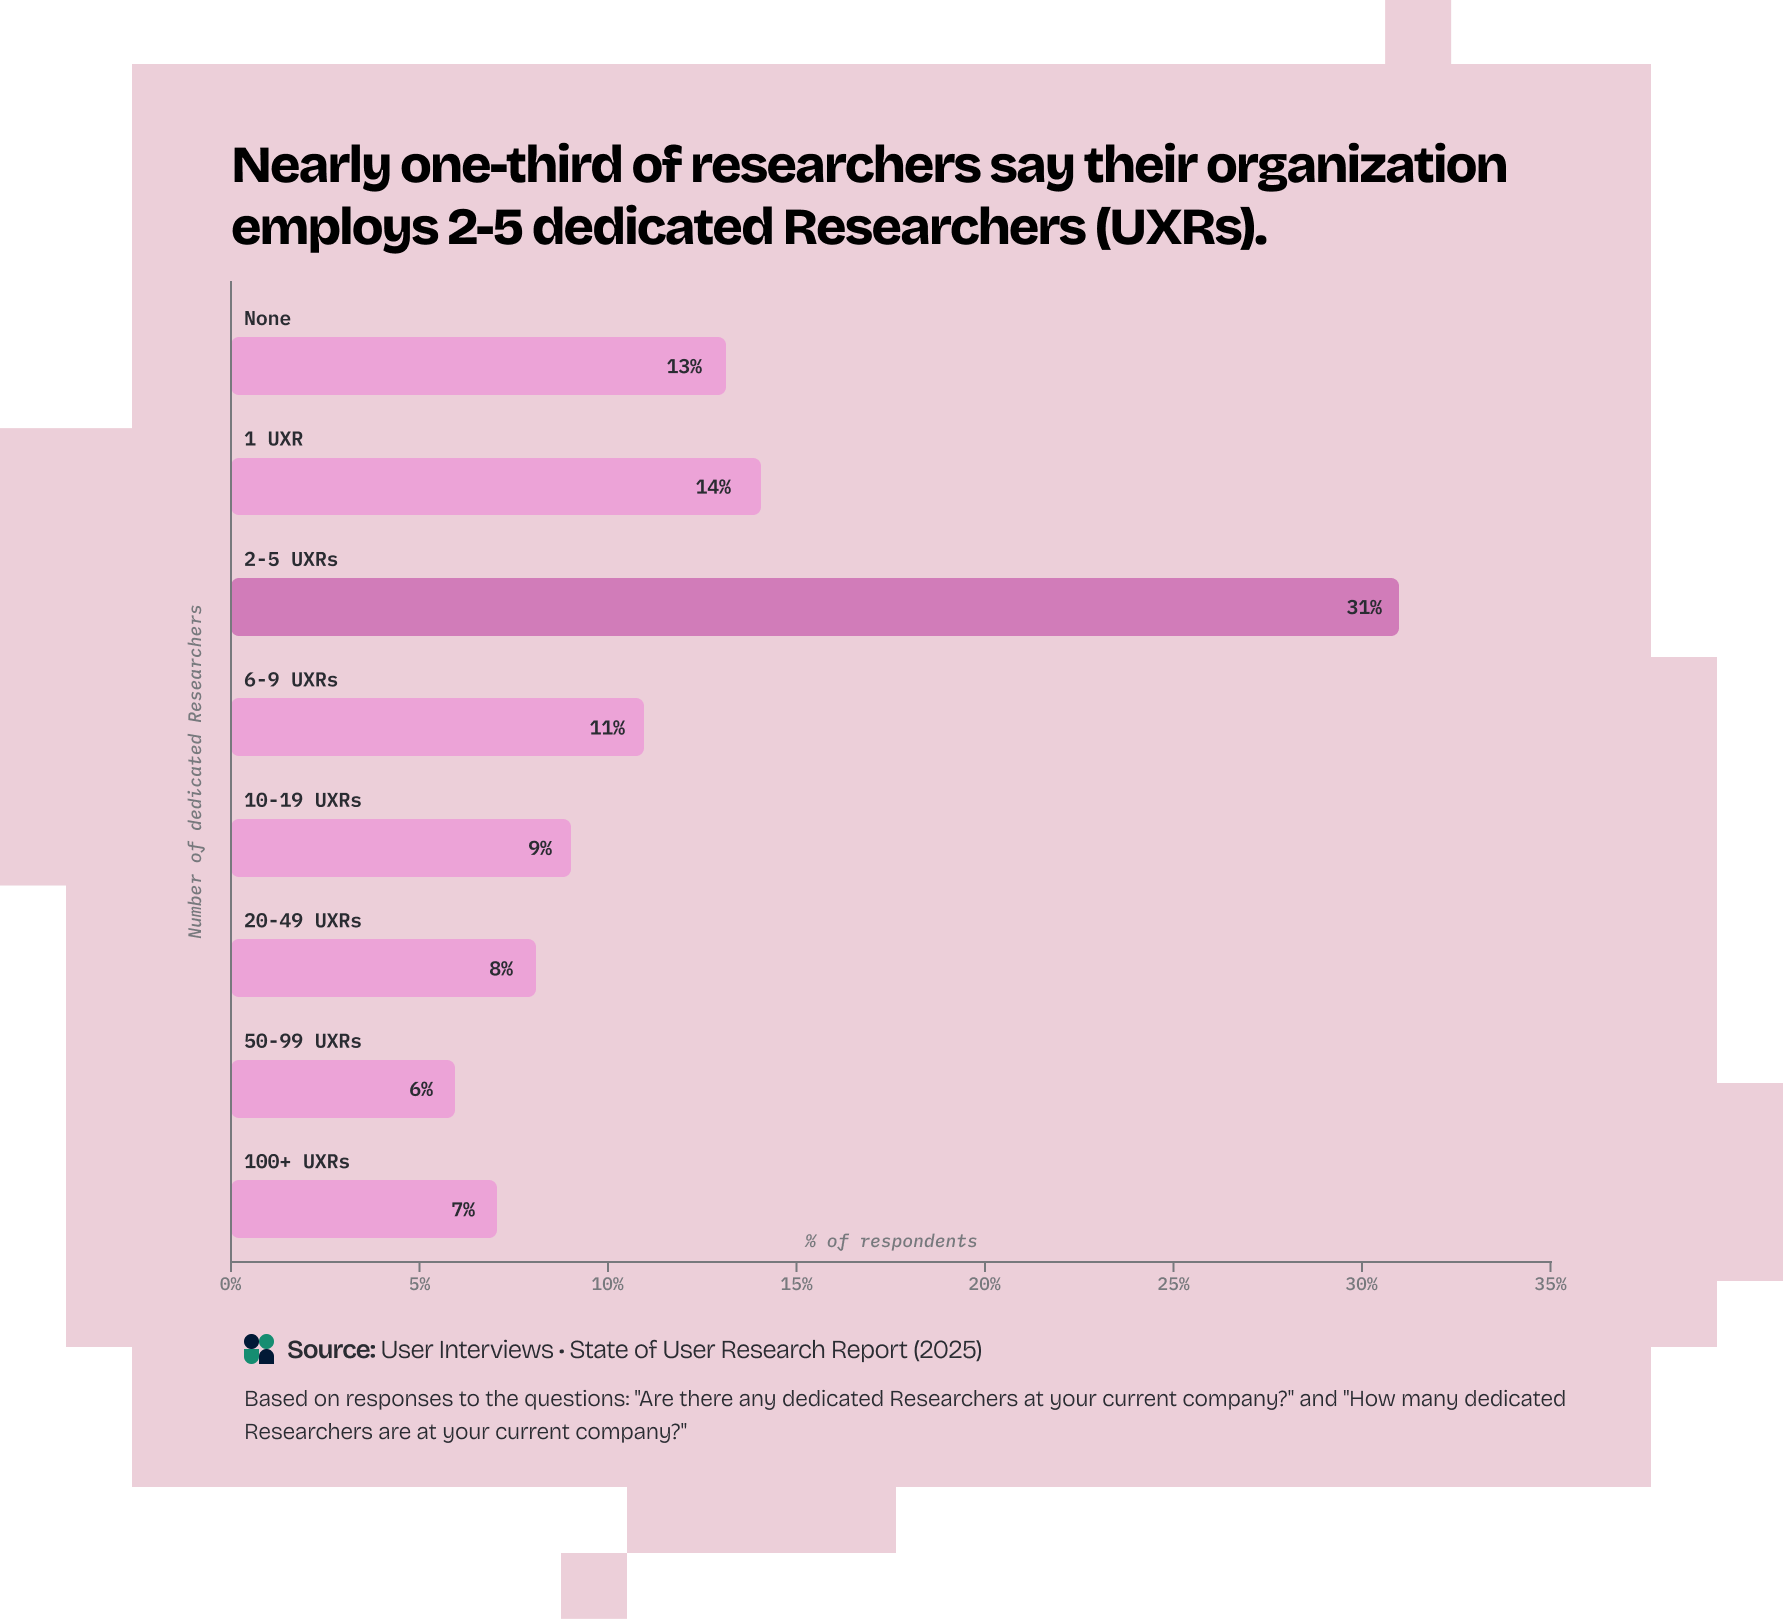
Team sizes distribute across a spectrum: Nearly one-third of respondents say their organization employs 2-5 dedicated Researchers. Beyond this, team sizes distribute relatively evenly across the spectrum from solo practitioners to teams exceeding 100 Researchers.
The smallest teams cluster predictably in smaller companies. Eighty-three percent of respondents who said their organizations had no dedicated Researchers and 78% of respondents with just one Researcher come from companies with fewer than 1,000 employees. Conversely, 95% of respondents who said their organizations employ 50+ Researchers were employed at enterprises. Notably, 62% of those on the largest teams (100+ Researchers) said they worked for Technology and Software companies, representing 14% of all tech company respondents.
Eighty-six percent of researchers at solo-UXR organizations report team tenure of five years or less. And 95% of respondents on teams with one year or less of tenure said their company had between one and five Researchers total. Meanwhile, 69% of those at an organization with 50+ Researchers said their team was older than six years, and 56% of respondents at companies with 100+ Researchers said their teams had been established for more than 11 years.
Seventy-six percent of respondents that said they were on a team that had been for 11+ years were at an enterprise company.
Teams reporting to Design:

Teams reporting to Product:

Teams reporting to UX:

Research teams don’t consolidate around a single “optimal” size, but rather scale to meet varied organizational needs. Teams start small and invest over time in institutional knowledge and organizational relationships, building toward larger, more established practices.
The data reveals a maturity curve: teams build capability gradually, typically requiring sustained investment over 6+ years to develop sophisticated practices. This pattern appears consistent across industries and geographies.
However, AI may be compressing this timeline. Early-stage teams recognize AI as a force multiplier that helps them compete despite limited resources and experiences—93% of researchers on teams with less than one year of tenure have adopted AI into their research practices. Whether this acceleration produces teams with genuine maturity or simply teams that appear productive without developing the depth and stakeholder relationships that characterize established functions remains to be seen.
The typical trajectory—start small, build gradually, mature over time—assumes organizational patience and sustained investment. However, pressure dynamics suggest that organizations lack this patience, expecting mature capabilities from immature teams.

Infrastructure remains minimal: Just 35% of researchers said their organization has a research operations (ReOps) presence.
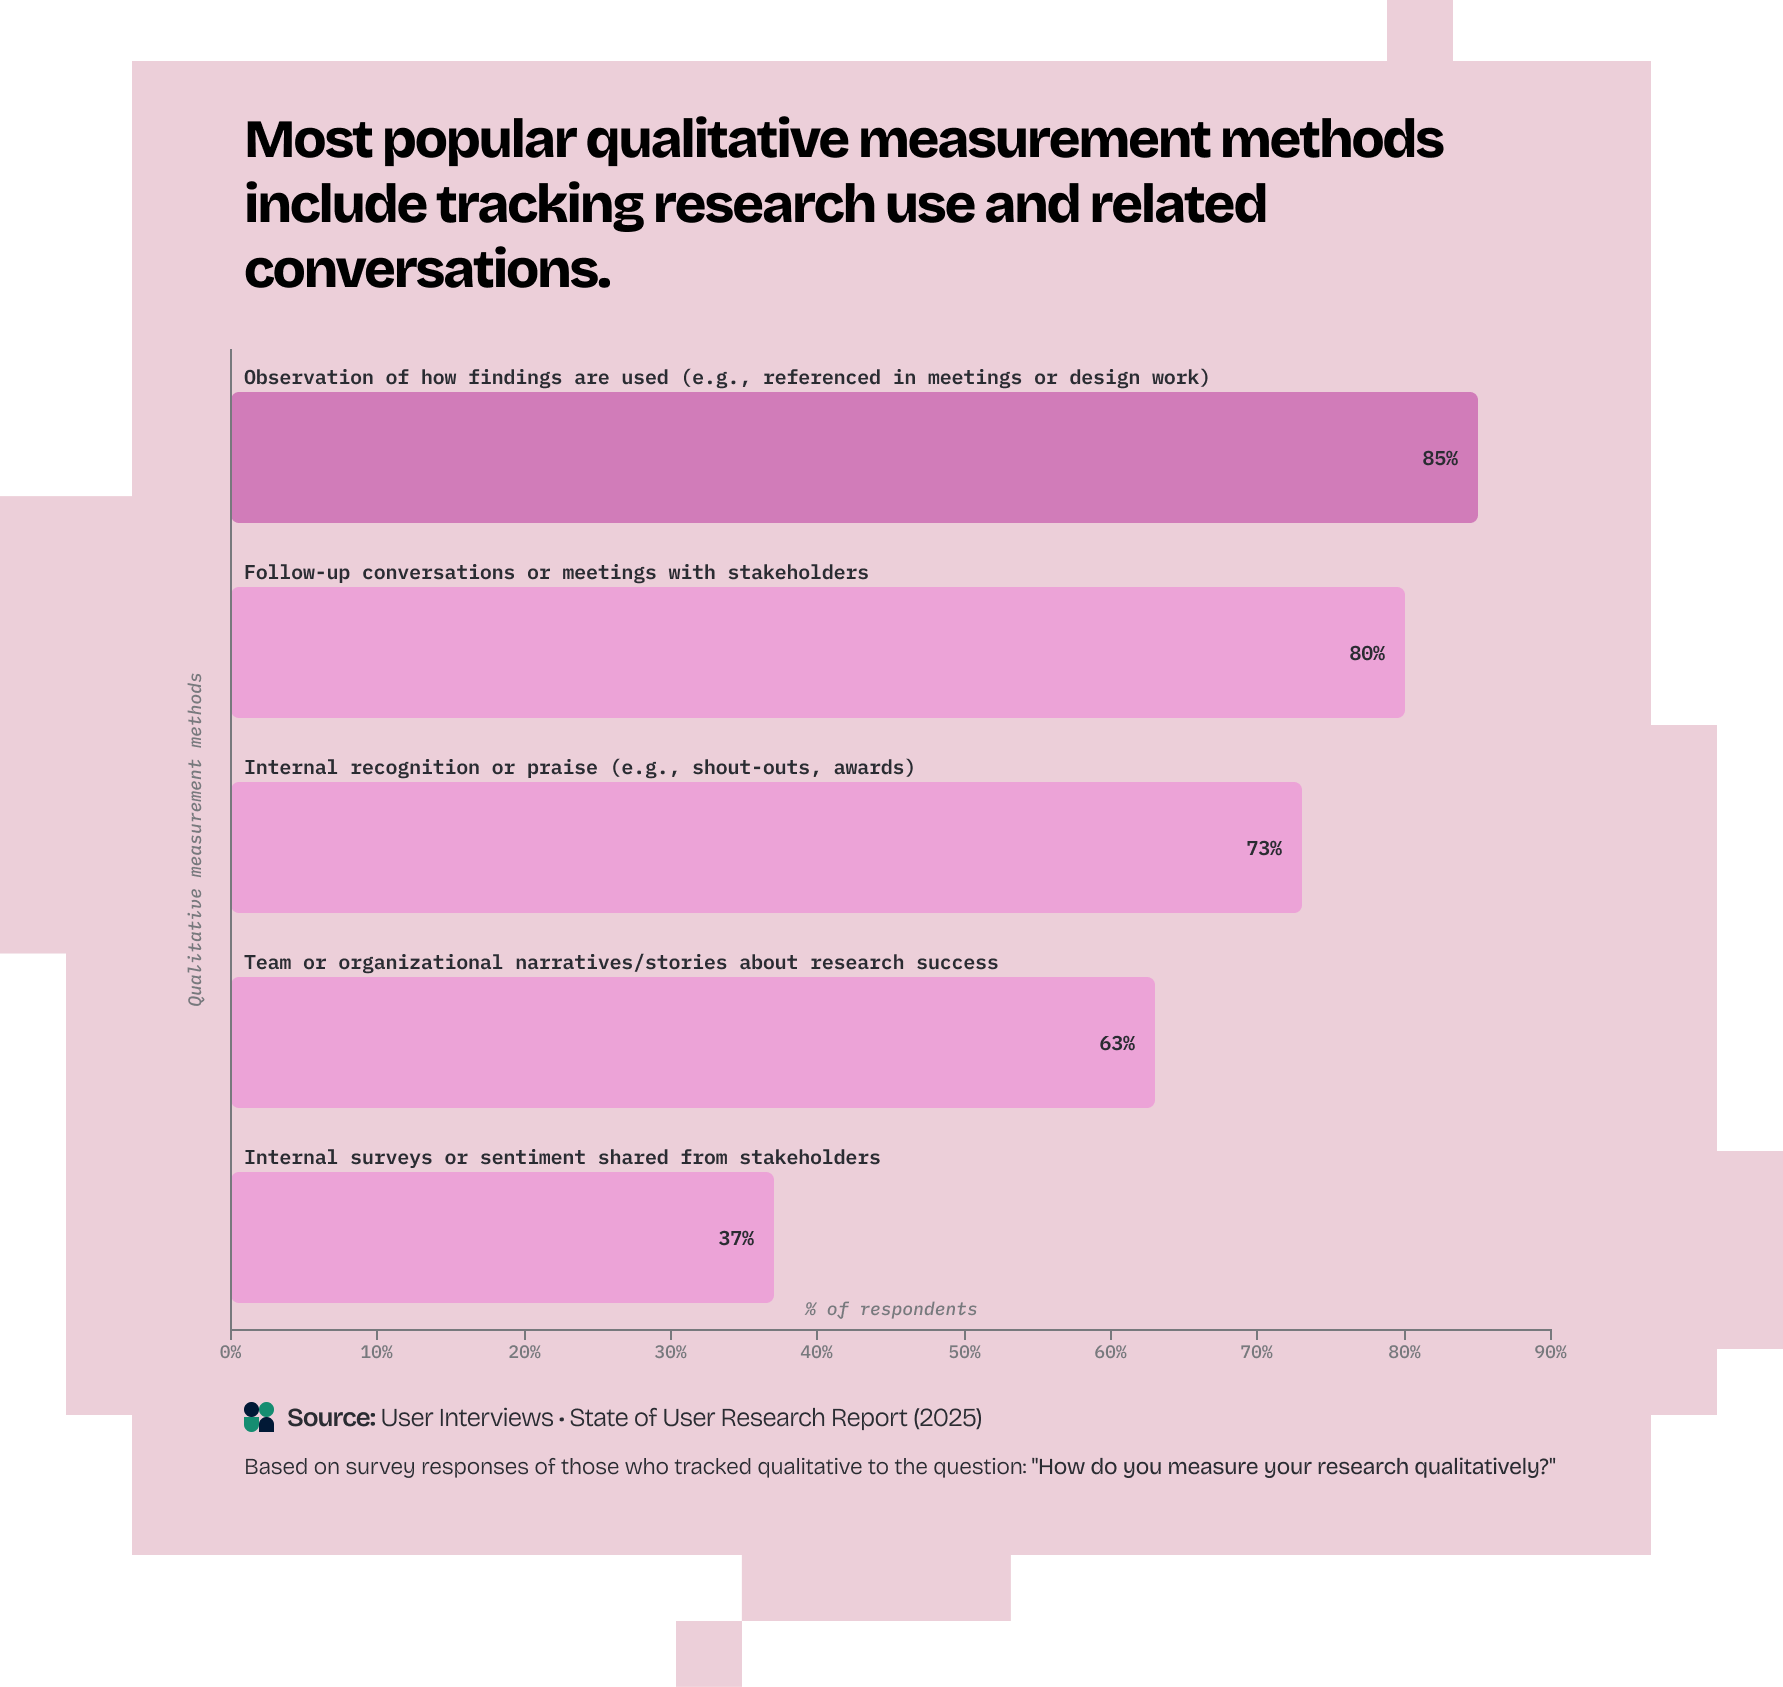
Measurement is widespread but inadequate: Eighty-three percent of researchers track their impact qualitatively, most commonly through observation of how findings are used (85%), follow-up conversations or meetings with stakeholders (80%), and internal recognition or praise (73%).
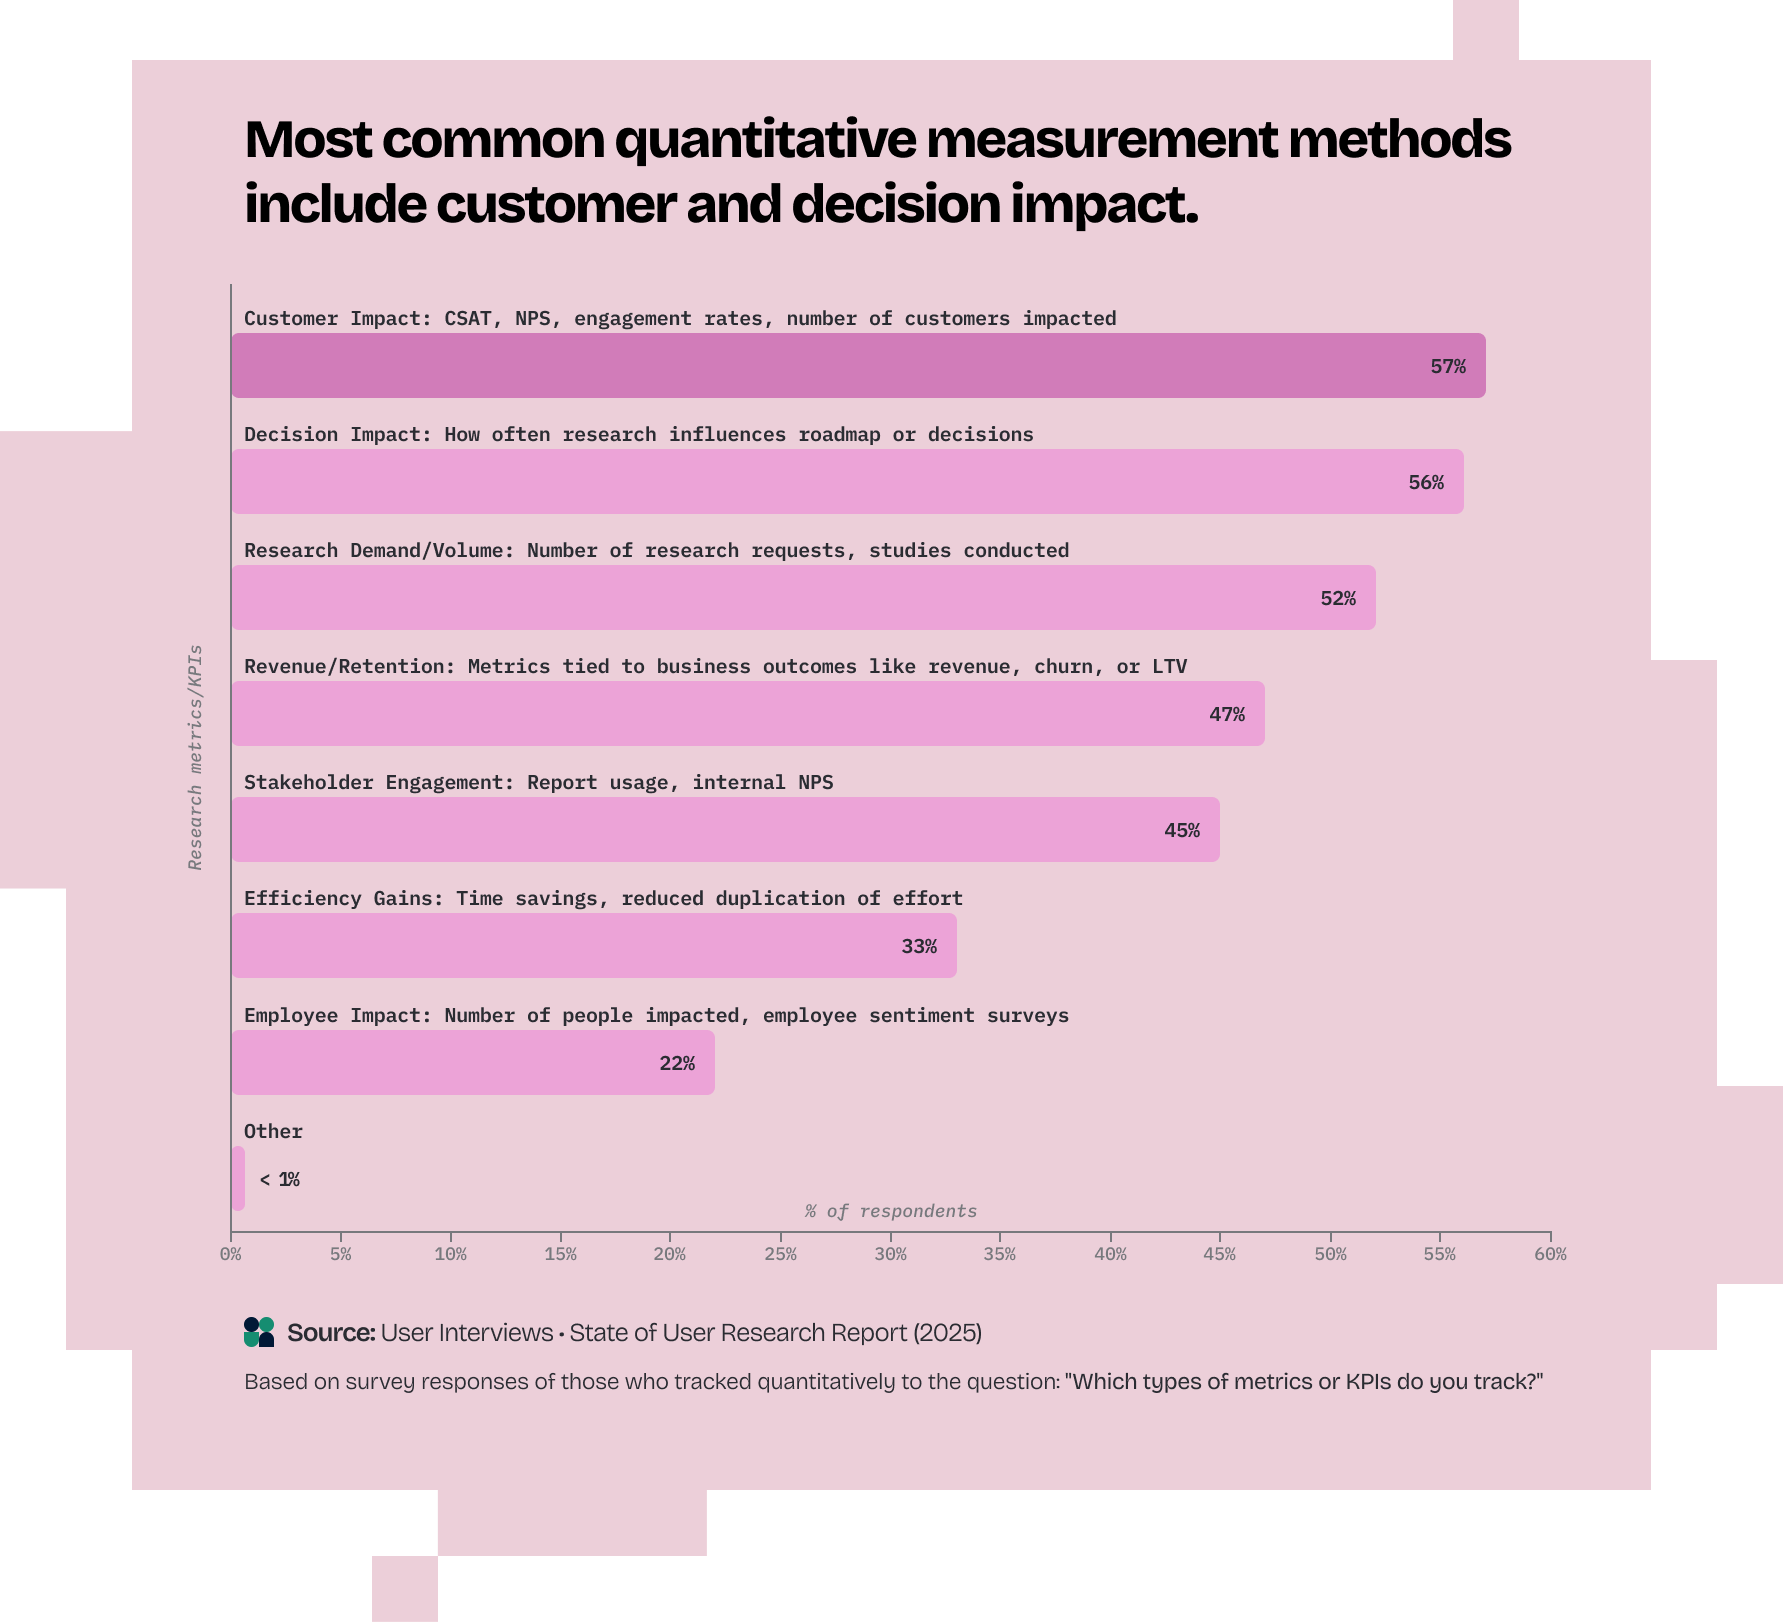
Forty-six percent track quantitatively, focusing on customer metrics like NPS or engagement (57%), decision impact such as roadmap influence (56%), and research demand including study volume (52%).
Yet only 21% of researchers find these approaches satisfactory.
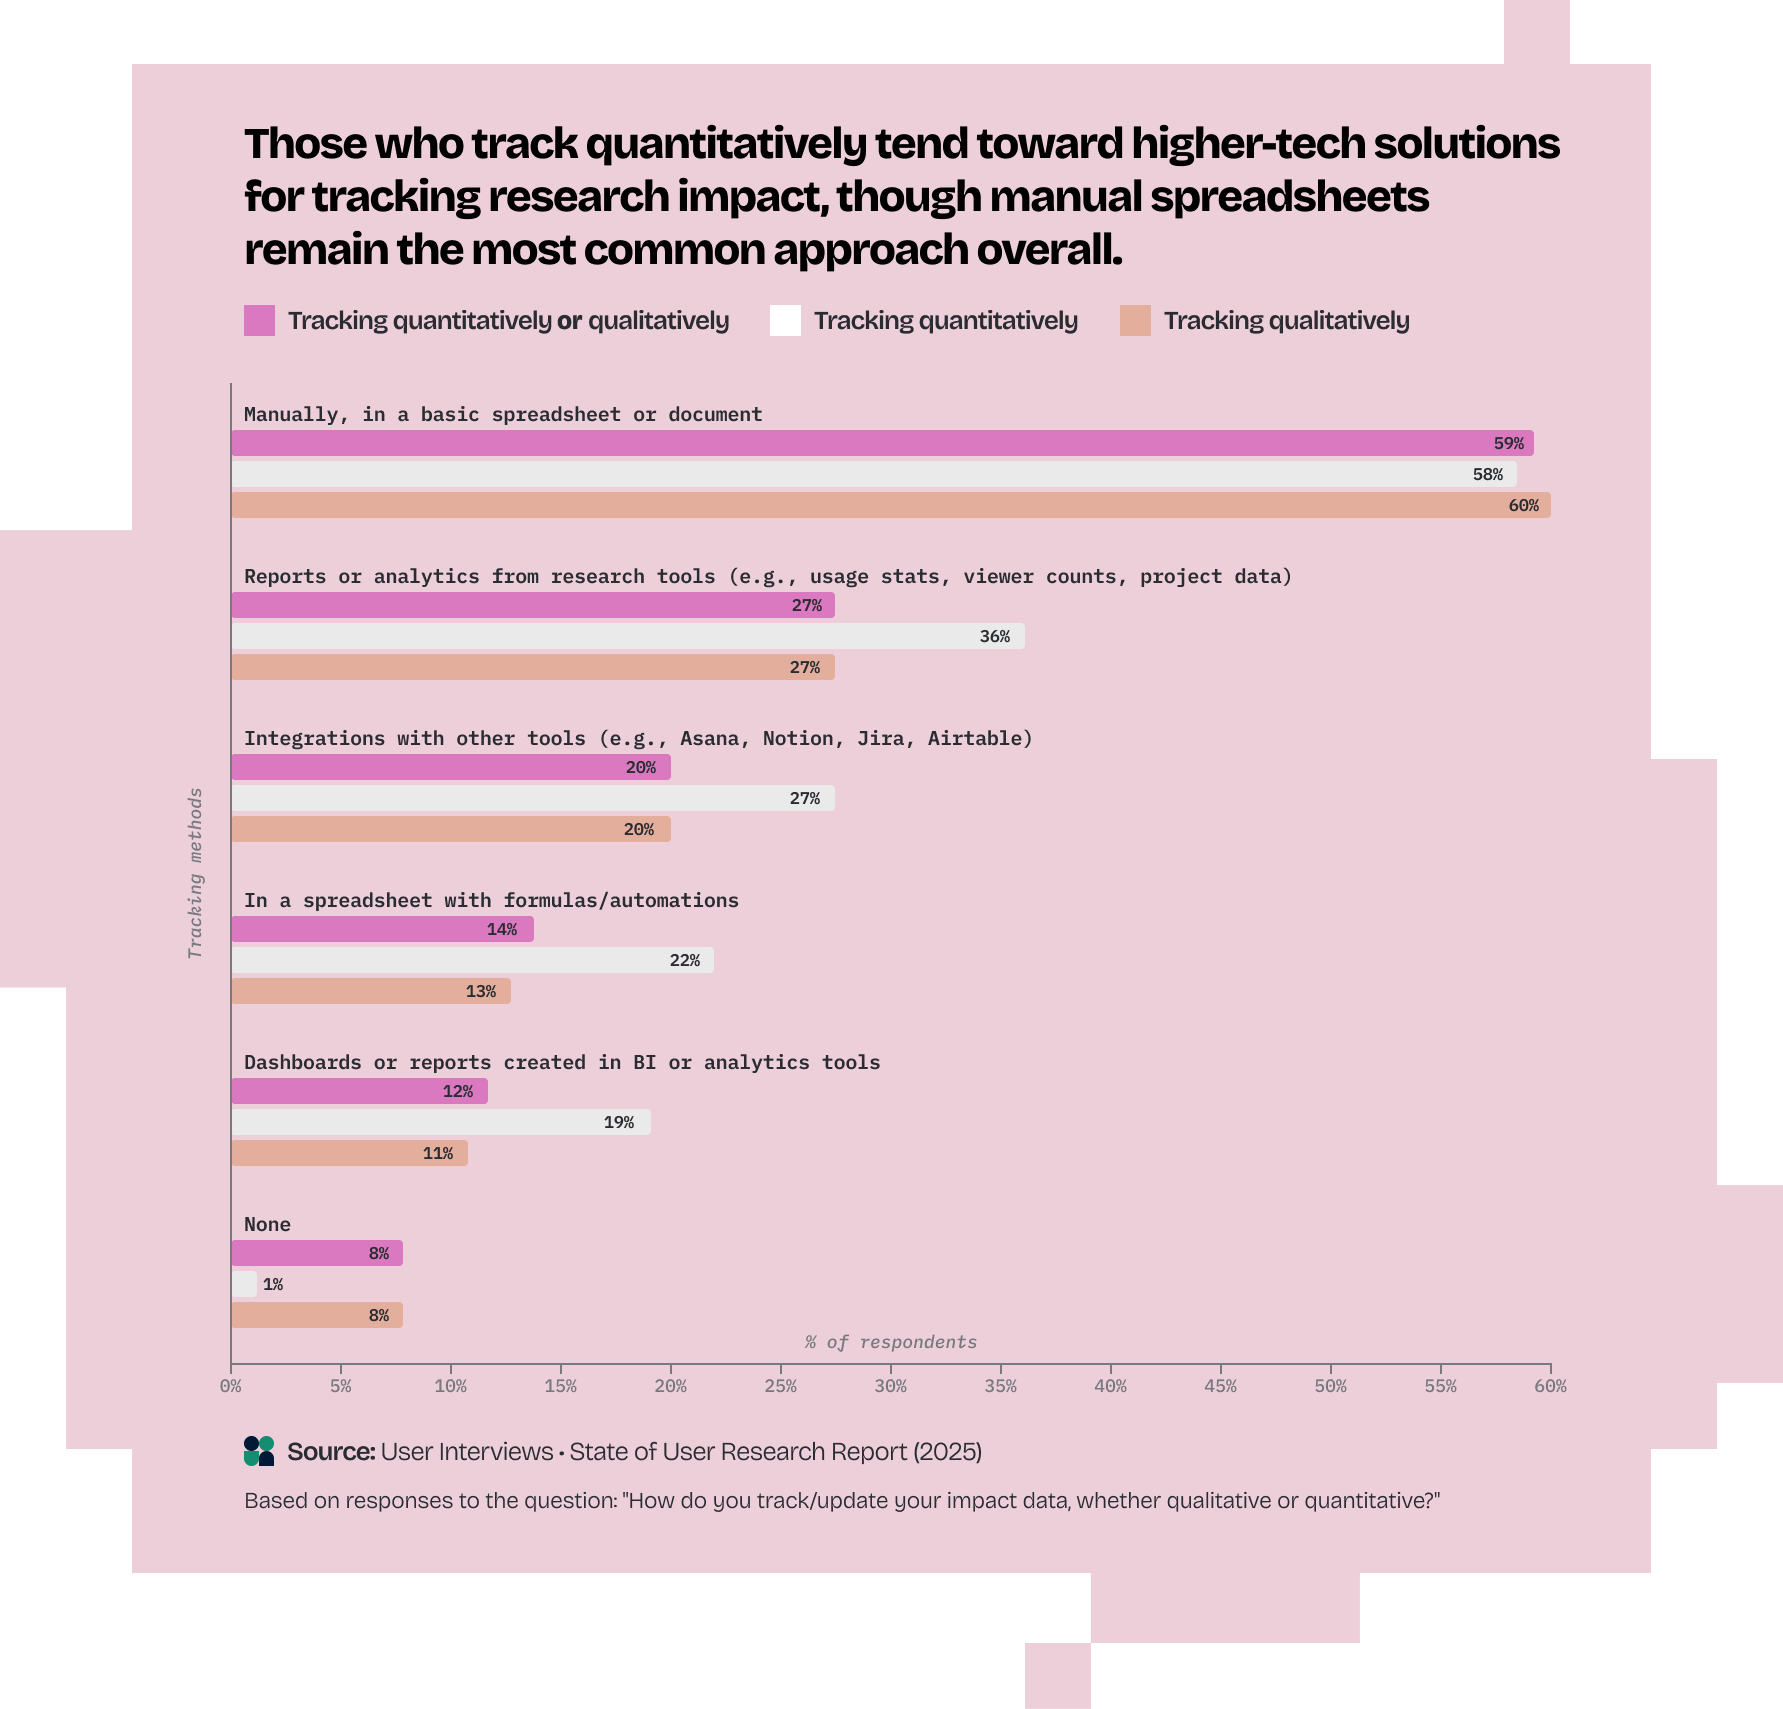
Manual processes dominate: Among researchers who track impact, 59% rely on spreadsheets or documents. Only 27% use analytical dashboards or BI tools, and just 20% leverage integrations with project management platforms.
Measurement types complement rather than compete: Among researchers who measure quantitatively, 89% also measure qualitatively. Those who track quantitatively tend toward higher-tech solutions, though manual spreadsheets remain the most common approach overall.
Method selection reveals constraints: While 87% of researchers choose methods based on the research question, 74% of researchers cite time as a primary factor. Half (52%) disagree with the statement: “In my organization, expectations around demonstrating research impact/ROI influences the types of research we prioritize or conduct.”
Common methods used by researchers remain stable: Interviews (92%), usability testing (73%), and surveys (72%) dominate. Concept testing is trending at 64%—a 6 pt increase from 2024.
Established teams measure more comprehensively. Ninety-three percent of those with a research team that has been established for 11+ years said they measure qualitatively, and 92% of those on 11+ year old teams said they track observations of how their organization uses research findings. These respondents on mature teams also said they measure stories of their impact at higher rates (78%). Notably, 96% of them said they also prioritize the research question when selecting methods. They also said they did heuristic testing at higher rates (40% vs baseline of 27%).
Sixty-three percent of respondents on 11+ year old teams also said their company had a ReOps presence, compared to 9% of respondents on teams younger than one year.
Researchers at companies with a ReOps presence track quantitatively at higher rates (51% vs 42% without), measure demand metrics more consistently (65% of those with ReOps who measure vs 44% who measure without ReOps), track efficiency more frequently (40% vs 26% without ReOps), and monitor decision impact more systematically (65% vs 49%).
Researchers at enterprise companies said they measure qualitatively at higher rates (88% versus 77% at smaller companies). Though they measure quantitatively at similar rates to researchers at other companies, they track decision impact more frequently (62% versus lower rates elsewhere). Interestingly, researchers at SMB companies said they conduct surveys and usability testing at higher rates (80% and 78% respectively), though only 19% evaluate heuristics. Just 78% of researchers at the smallest companies (< 50 employees) cited the research question as a selection factor.

Fifty-seven percent of researchers who say ROI drives their projects track quantitatively, versus only 41% of those not focused on ROI.
Eighty-seven percent of those with dedicated Researchers keep track of observations of how their organization uses findings vs 73% without dedicated Researchers.
Organizations with 100+ Researchers conduct literature reviews at rates of 71%, while only 32% without dedicated Researchers do. Similarly, 61% of organizations with 20+ PwDR conduct literature reviews, versus only 38% with no PwDR. The presence of dedicated Researchers also affects whether teams track how findings are used: 87% with dedicated Researchers monitor this versus 73% without.
Only 27% of European researchers agree that ROI influences the types of research conducted or prioritized in their organization. Additionally, 37% of European researchers track quantitatively, compared to nearly 50% elsewhere globally.
North American researchers track narratives at higher rates (69% versus 56% globally), measure revenue metrics more frequently (51% versus 42%), and lead in customer metrics tracking (62% versus 51%). They also conduct concept tests more often (71% versus 55% elsewhere) and feel time pressure more acutely when picking their methods (79% versus 69% elsewhere).
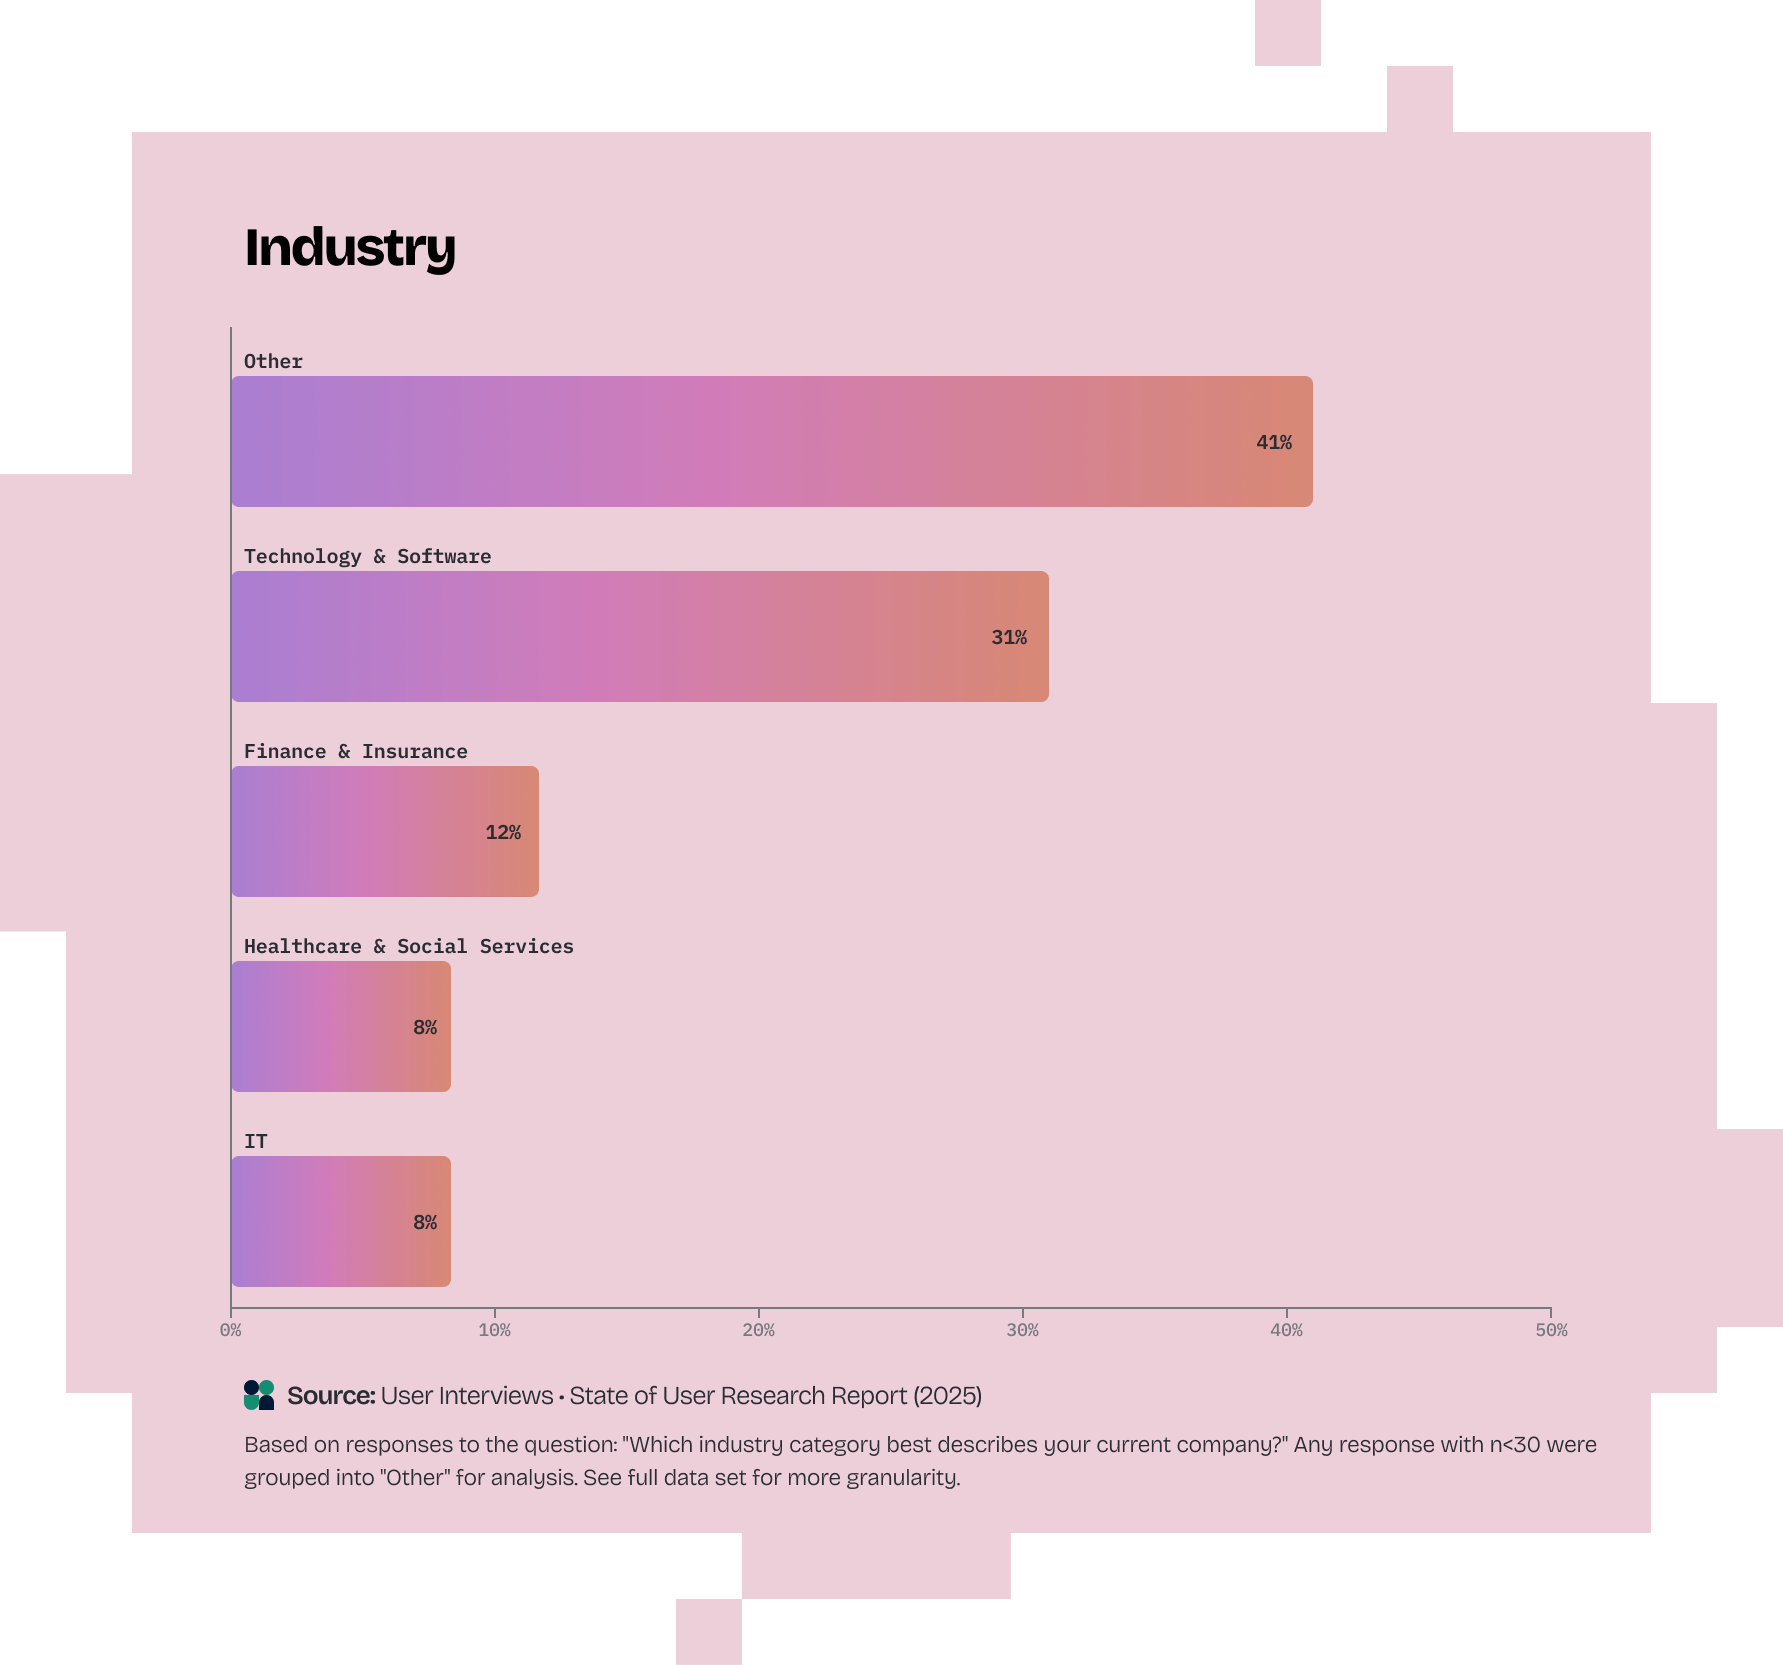
Researchers at Finance & Insurance lead usability testing at 83% (vs 72% baseline) while researchers at Technology & Software companies favor concept testing at 72% (vs 64% baseline).
A problematic pattern emerges: teams that most need to prove value (newer, smaller teams) have the least capability to do so, while teams in secure positions (mature, large teams) have adequate infrastructure.
This creates a cycle that undermines the field. Early-stage teams struggle to measure at all—without established processes and organizational expectations, they focus on conducting research rather than tracking impact. Yet these are precisely the teams facing pressure to justify their existence.
Mature teams measure more often, in more ways, with better infrastructure. This maturity also enables more rigorous research practices. However, democratization may lead leadership to expect accelerated research output, potentially undermining the rigor that mature teams work to maintain.
The measurement patterns reveal distinct purposes: As we’ll see more of below, researchers track efficiency when research must justify how it consumes resources—a defensive response to organizational pressure. Monitoring decision influence requires both attention to and access to decision-making processes. Numbers demonstrate scale and how outcomes align with the business, while stories provide context and emotionally resonate with stakeholders. Both serve essential but different functions.
The fact that most researchers track impact manually, despite widespread dissatisfaction with measurement approaches, represents a systemic failure to invest in the operational foundation—like ReOps and quantitative measurement tools—that would make research scalable.
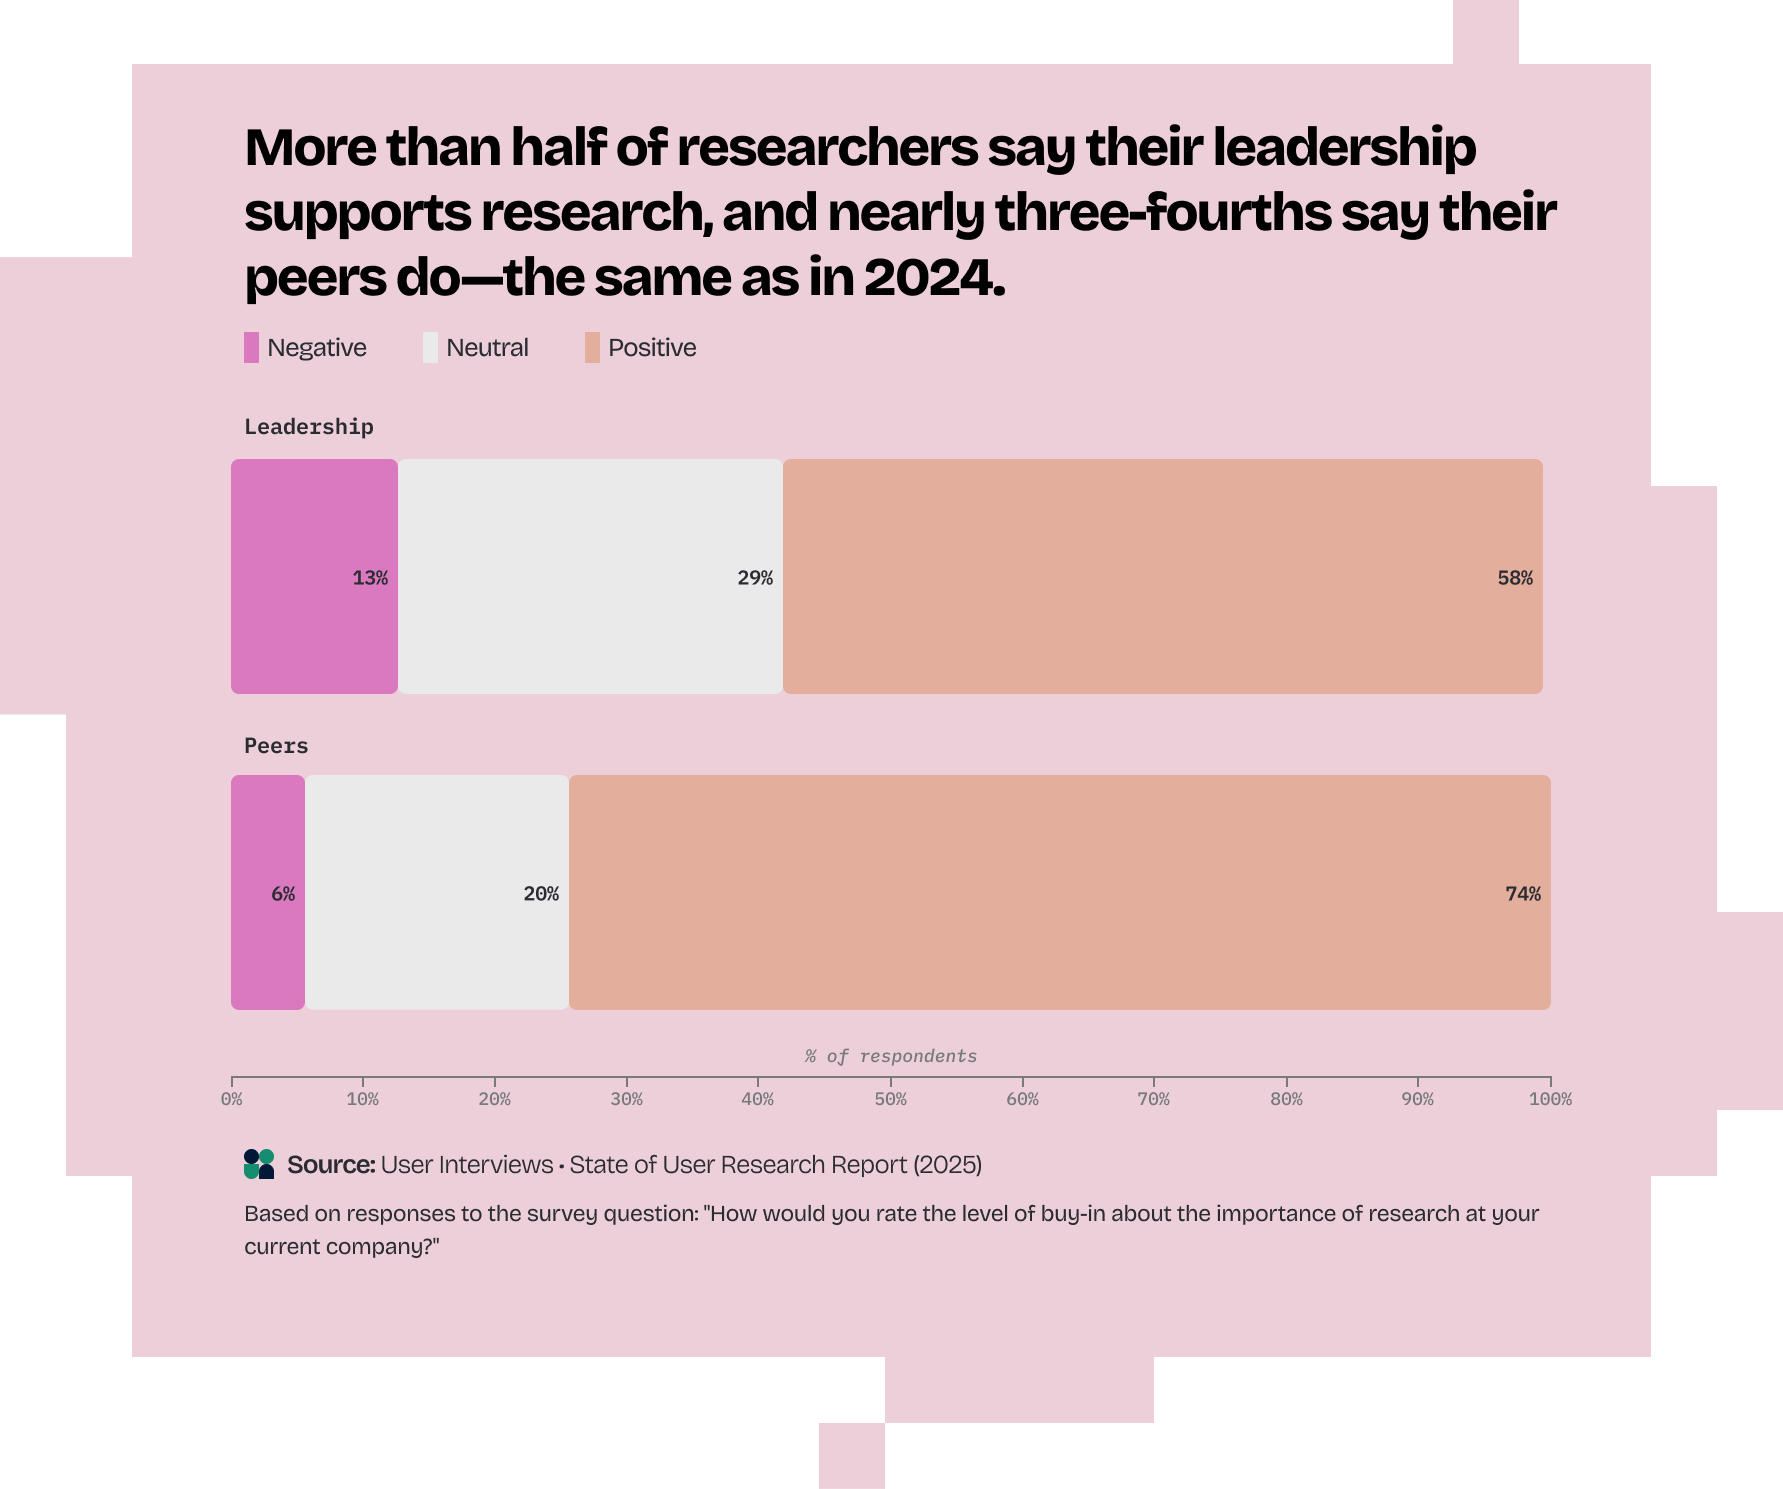
Leadership and peer buy-in stagnates year over year: While 74% of researchers say their peers see the value in research, 58% say their leadership does as well.
The pressure intensifies at scale: despite working in organizations with the largest research teams and longest tenure, 52% of enterprise researchers rate their leadership buy-in positively.
Nearly half (49%) of researchers in Europe report positive leadership buy-in, significantly below other regions. This may reflect a circular problem: researchers who measure quantitatively find it easier to secure leadership support, yet organizations without strong leadership buy-in invest less in measurement infrastructure.
Researchers at organizations that conducted layoffs focus heavily on proving worth through visible metrics. These researchers track decision impact at much higher rates (71% versus 51% at organizations without layoffs) and measure efficiency more frequently (49% versus 28% elsewhere). Yet buy-in drops to just 40% for leadership and 65% for peers in these environments.
Buy-in has hit a ceiling. Simply existing and producing insights won't deepen research's strategic role—organizational complexity and competing priorities block the path forward.
The layoff data also reveals a troubling cycle: when organizations cut dedicated Research staff, it signals leaders are less convinced of research's value, which further limits whether Research can demonstrate impact and invest in its future. Functions facing constant pressure to prove value make different choices than those with secure positions—they focus on short-term wins (reactive) over long-term strategic work (proactive), chasing visible metrics over deep insights, and operate reactively rather than proactively.
This defensive posture fundamentally shapes how research operates within organizations and how leaders perceive its value.

The plane is airborne. Research has scaled—86% of researchers say their organizations have dedicated Researchers, and many established teams with sophisticated methods exist across industries.
Yet most research teams face four fundamental dilemmas captured by our findings:
The pressure is real and intensifying: Leadership buy-in has stagnated, and with researchers at organizations that conducted layoffs, it plummets to 40%. Researchers respond by shifting to defensive metrics—tracking efficiency and decision impact at significantly higher rates—even as they recognize this approach won’t secure research’s long term position.
The infrastructure doesn’t exist to succeed under this pressure: Only 21% of researchers find their measurement approaches adequate, most track impact manually in spreadsheets, and just 30% have ReOps support. Organizations invest in expanding research capacity through PwDR, but not in the operational foundation that would make research scalable.
The distributed model creates hidden costs. Research is more often embedded across functions rather than operating as an independent discipline. Democratization creates demand for dedicated Researchers but also imposes a “democratization tax”—senior researchers spend up to 25% of their time supporting others, constraining strategic capacity.
Maturity requires sustained commitment. Building sophisticated research practices typically takes 6+ years of sustained investment. Yet organizations facing pressure lack patience for this timeline, expecting mature capabilities from immature teams. AI may accelerate some aspects of this curve, but risks creating the appearance of productivity without genuine depth.
The result: a workforce spending significant time on workarounds—supporting PwDR, tracking impact inadequately in documents and spreadsheets, proving value through efficiency metrics—rather than strategic work. And buy-in that remains flat regardless of approach.
The mandate facing research teams in the next one to two years is stark: build the infrastructure, establish the measurement systems, protect the strategic capacity, and demonstrate clear value—or watch research fragment into a distributed capability with many practitioners, but no true champions.
Our analysis shows which teams succeed: those with sustained investment, operational infrastructure, sophisticated measurement, and protected strategic capacity. These elements don't emerge automatically from time and headcount. They require deliberate strategy, systematic infrastructure, ruthless prioritization, and demonstrated value.
What teams decide now—about measurement, AI governance, organizational positioning, and career pathways—will determine whether user research emerges from this period stronger and more essential, or whether it becomes a function that everyone does but no one leads.

Navigate with confidence. Join thousands of researchers using User Interviews to recruit participants, conduct studies, and prove research value.
Book a demoNon-Researchers whose titles fall into other categories (Design, PM, Marketing, etc).
With a capital “R,” people whose titles include UX/Product/Design/User Research, or similar terms. Also called “dedicated Researchers” or UXRs.
With a lowercase “r,” a catchall term for people who do or support research at least some of the time (a.k.a. all our survey participants).
People whose titles include Research Operations (Ops) or similar terms.
Collective term for dedicated Researchers and ReOps professionals.
When written with a lower-case “r,” research teams refers to everyone involved in research at an organization, whether or not they report to a Research department.
This report was written by Liz Steelman, with contributions from Nick Lioudis and assistance from Claude, ChatGPT, and Google Gemini. The webpage was designed and built in Webflow by Holly Holden with graphic support by Jane Izmailova.
The 2025 State of User Research survey was conducted by Liz Steelman and Morgan Koufos. Analysis was carried out in Google Sheets with the support of Maria Kamynina and Jessica Hays Fisher.
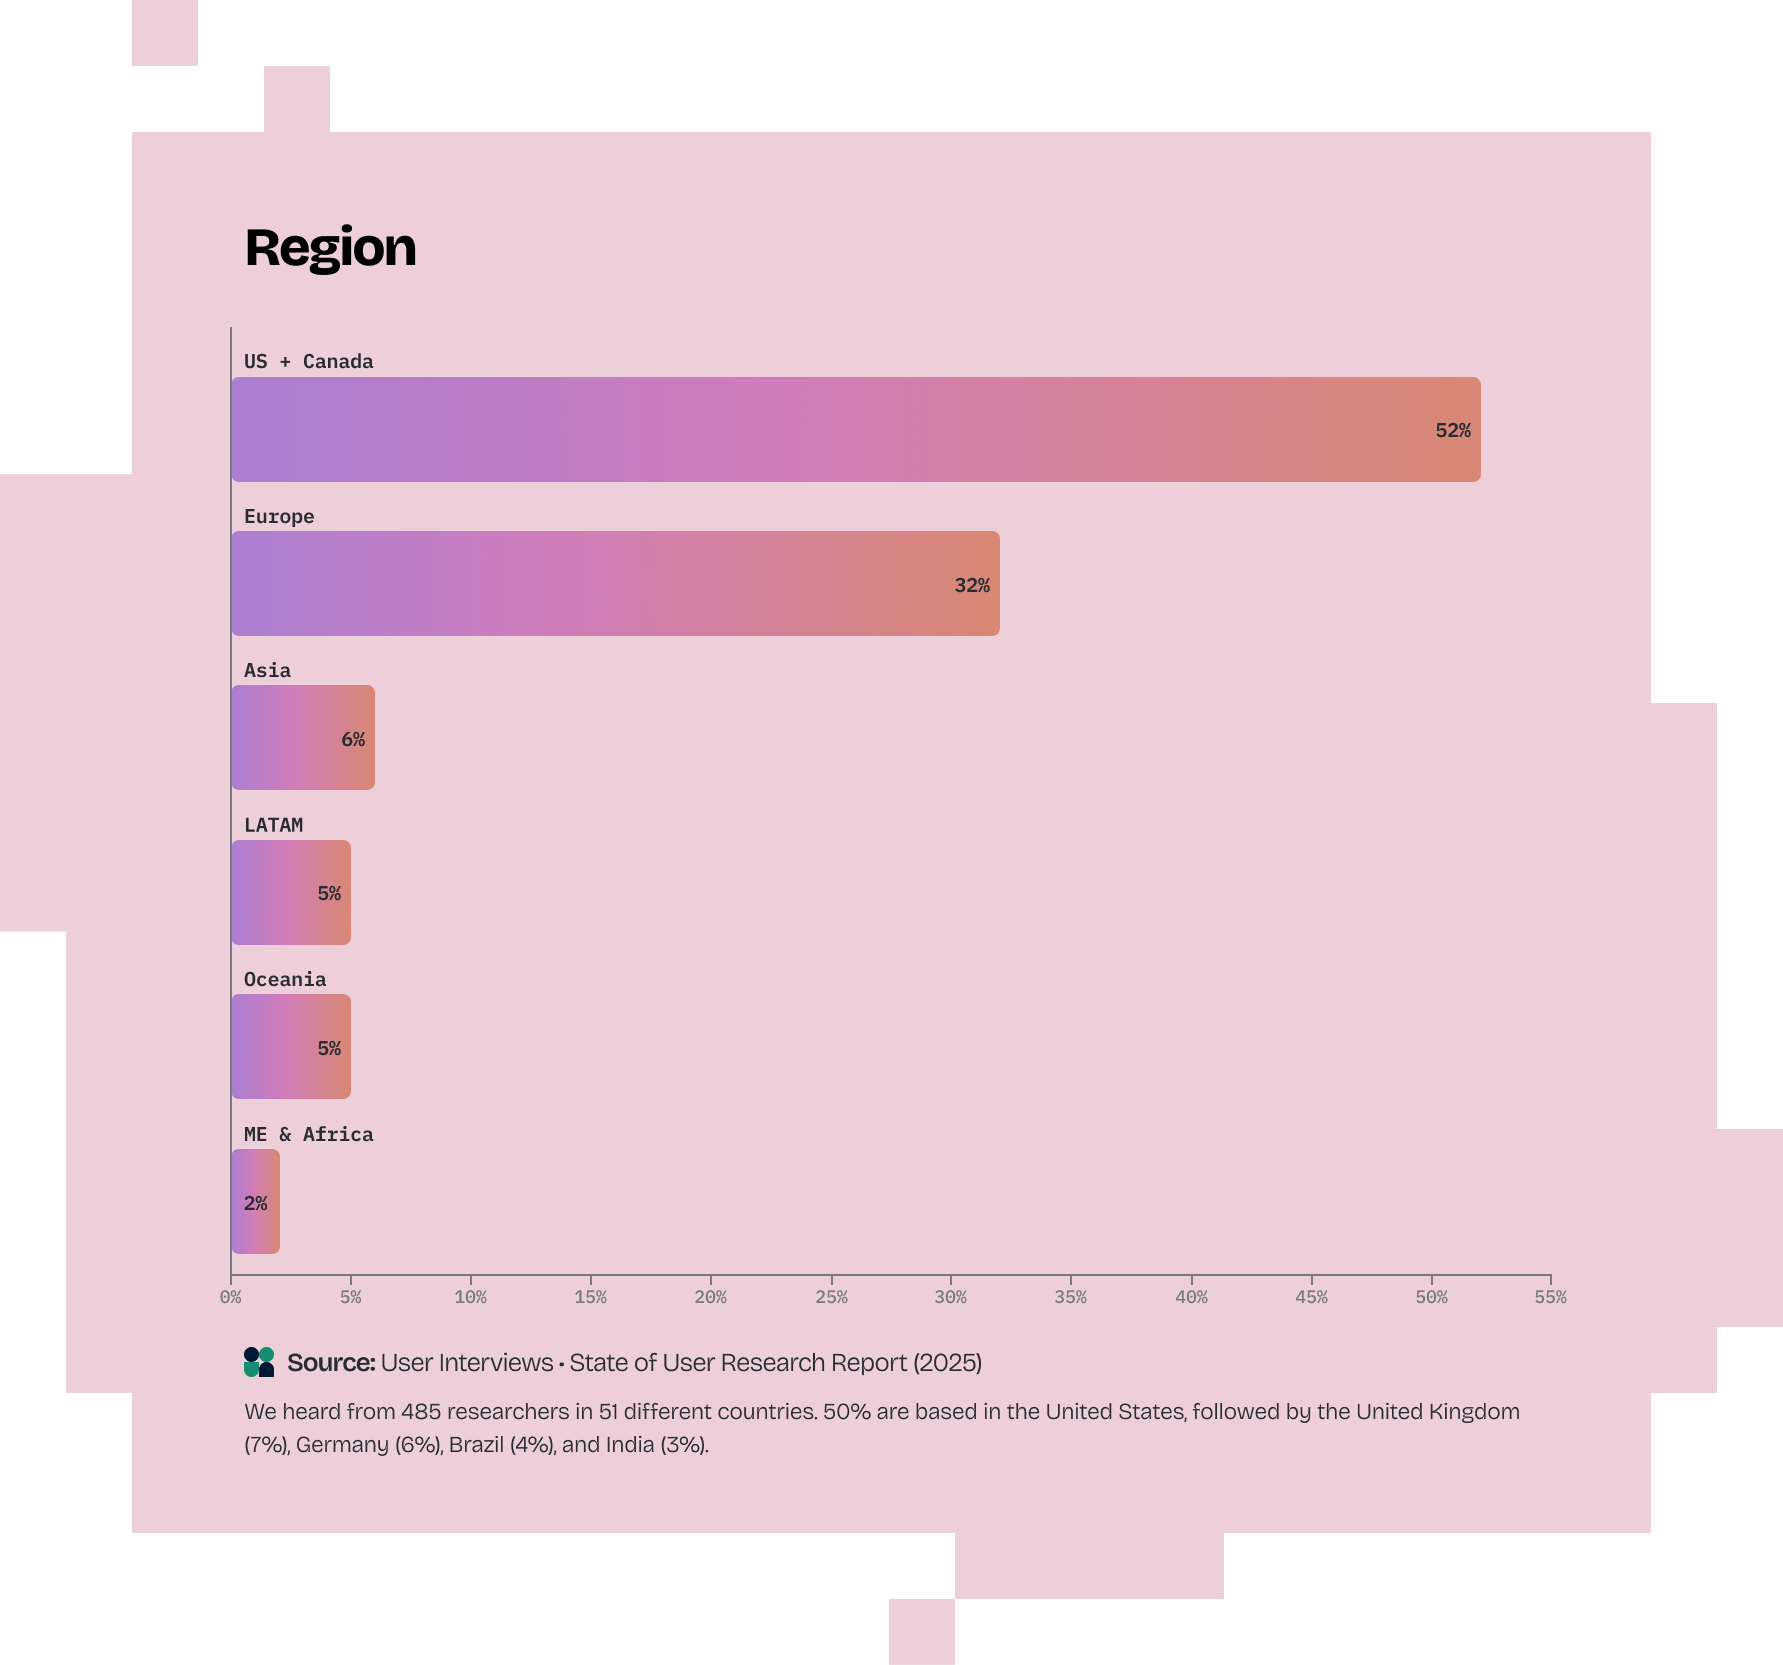
From July 25 to August 9, 2025, we collected 485 qualified responses via social media, our weekly newsletter (Fresh Views), and an in-product slideout; we posted the survey in research-related groups on LinkedIn and Slack; and members of our team and friends within the UX research community shared the survey with their own professional networks.
We are extremely grateful to our partners and everyone from the UXR community who shared the survey and contributed to the success of this report. Special thanks to Cha Cha Club and UXArmy!
Above all, we are indebted to the participants who took part in our survey. Thanks again!
Published: October 22, 2025
Want more insights? Read the full State of User Research 2025 Report.
Read the report