

When you’re running research at scale, proving ROI isn’t optional, it’s essential. Reports account for every hour, dollar, and study so you can back up your value with hard data.
Whether you’re making budget requests, scaling your program, or just keeping leadership in the loop, you’ll have real-time, reliable insights at your fingertips.
Your research has value. Reports make it undeniable. With three core reports at your fingertips, you’ll never again scramble to piece together data for that last minute presentation.
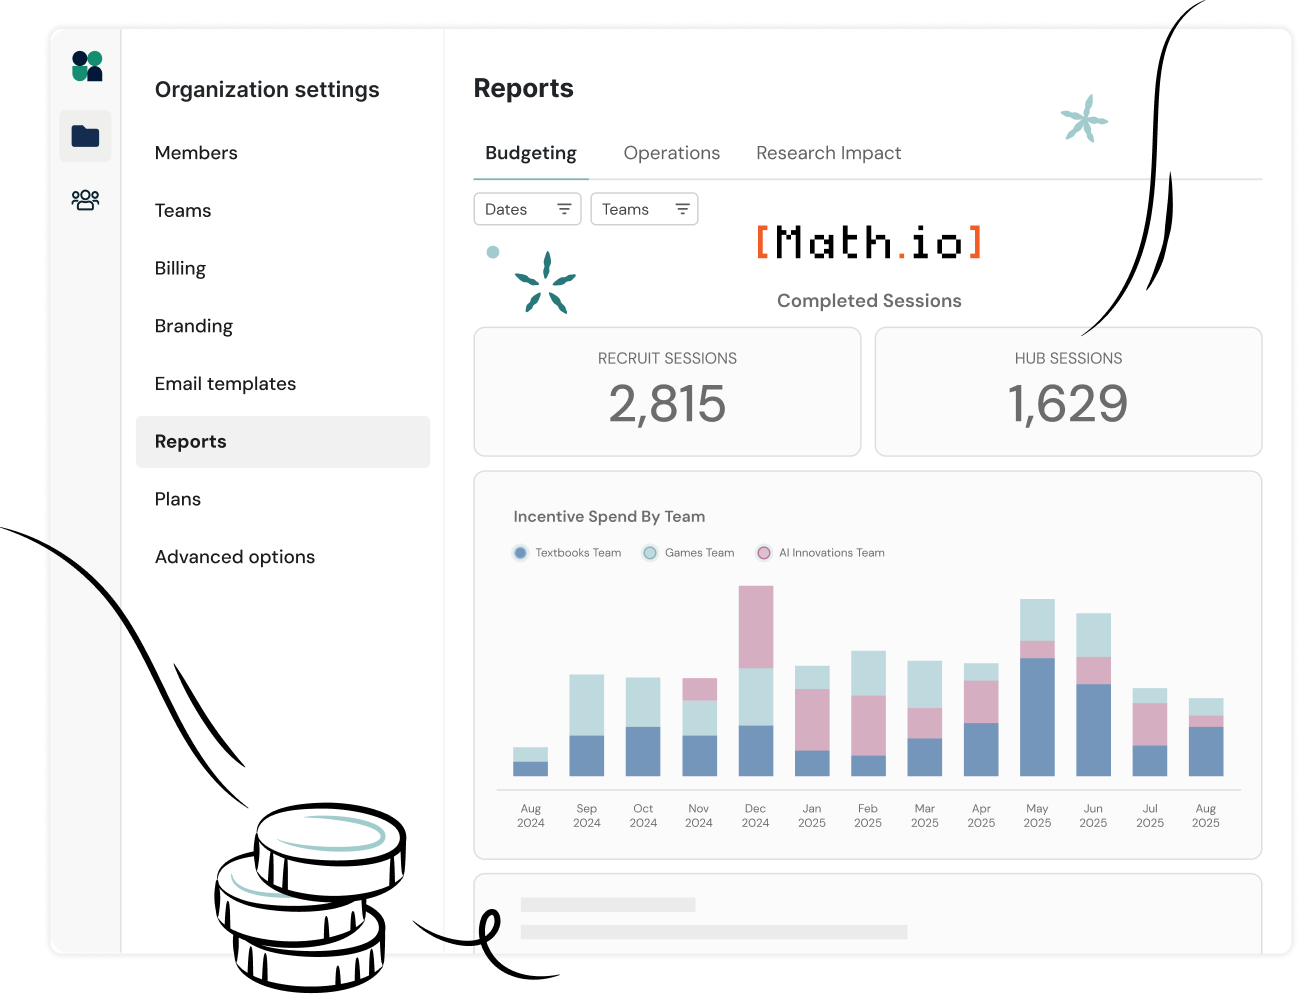
Get full visibility into how your research dollars are being used. Break down costs by team or by project to optimize spend and align incentives.
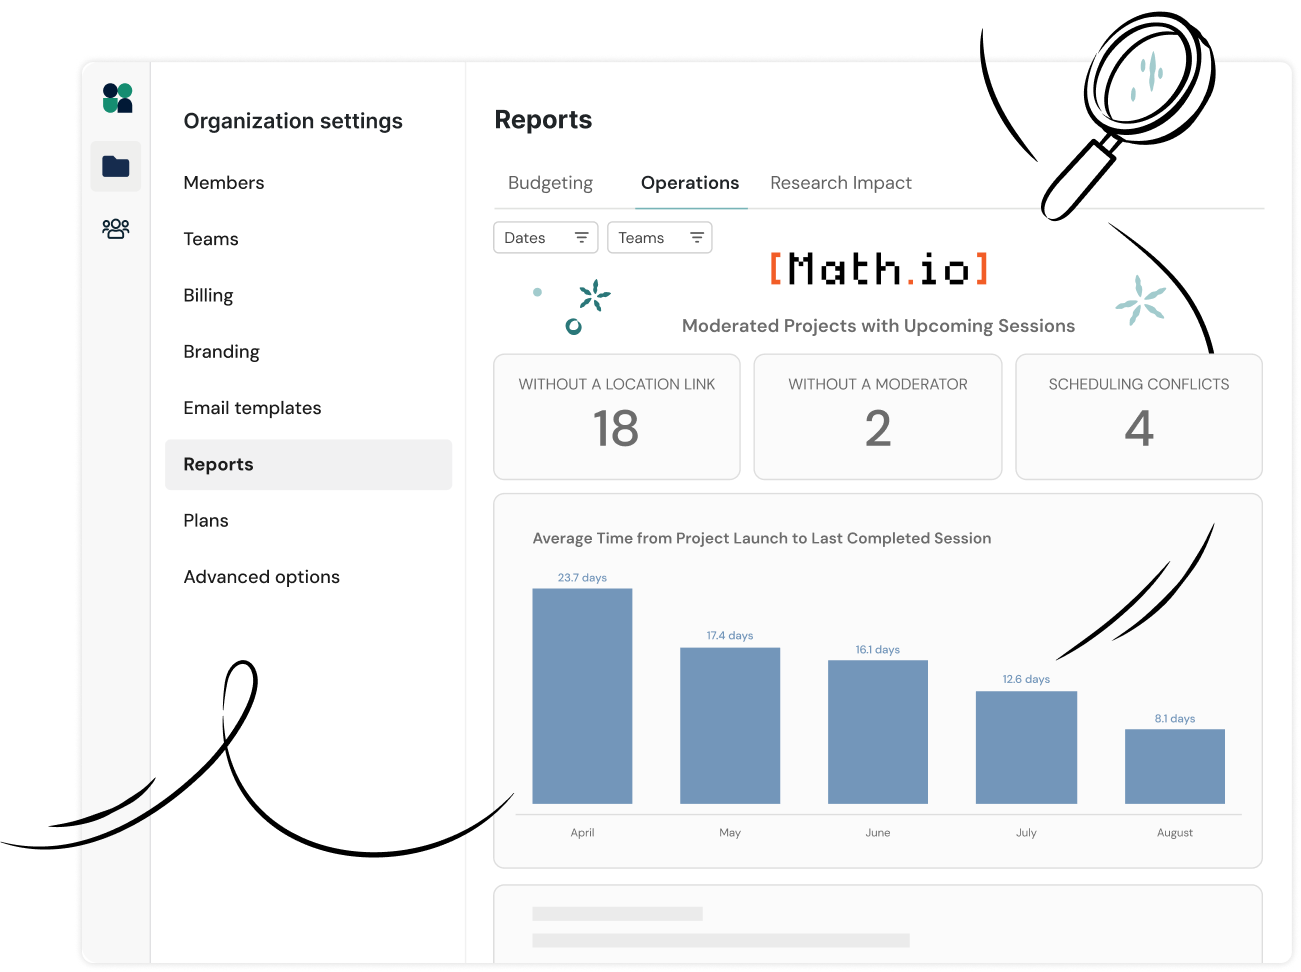
Your research pipeline at a glance. Your operations dashboard keeps a pulse on active studies, recruitment status, and flags upcoming studies that need attention.
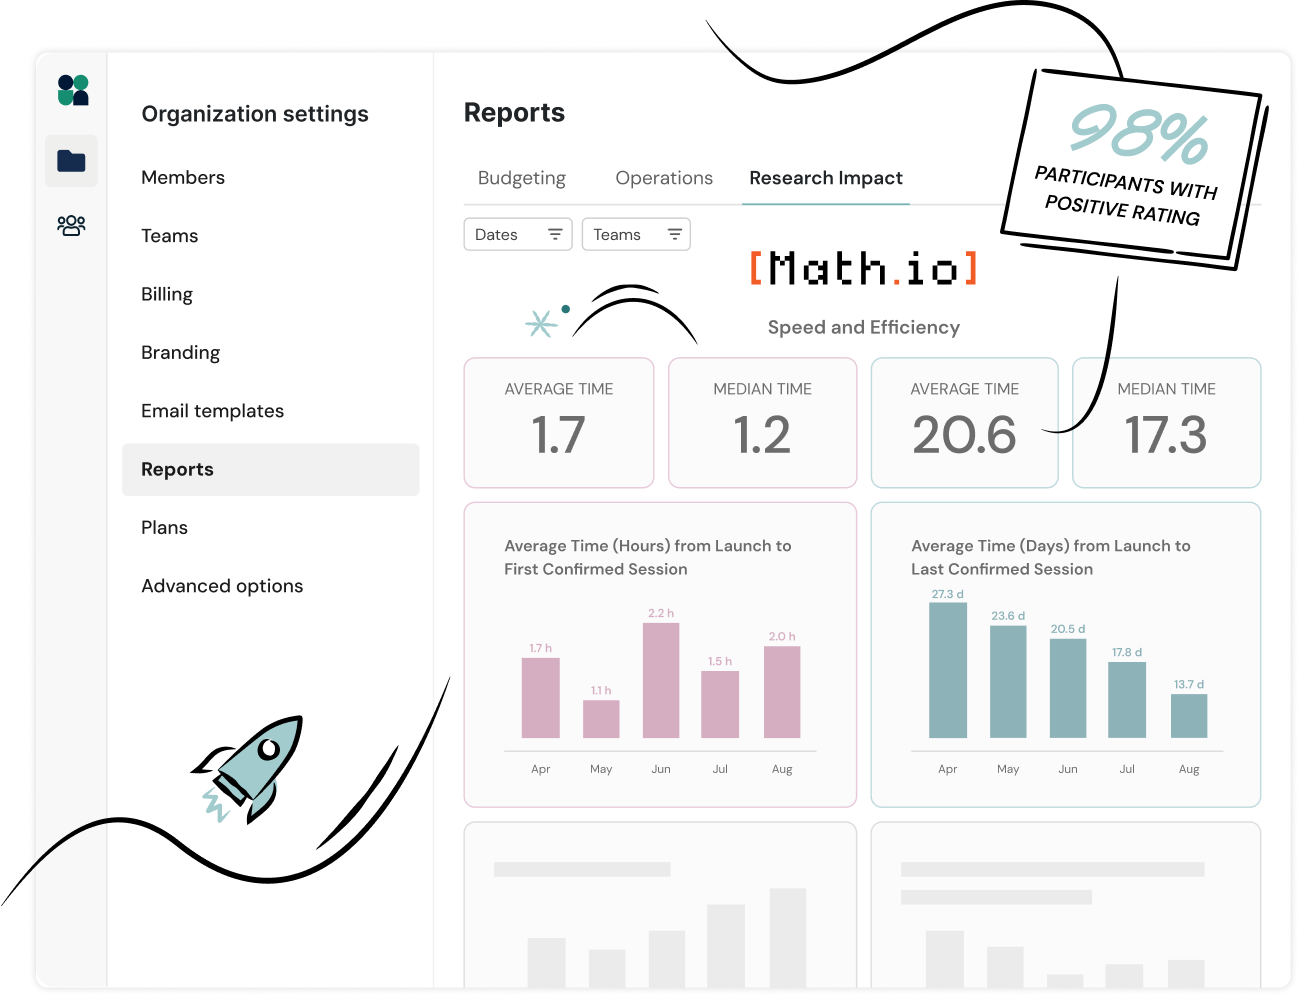
Prove the value of your work with data that shows research speed, scale, and insight quality. Drill down by project, team member, or research type.


"An analysis of our previous workflow versus end-to-end recruitment through User Interviews estimated a savings of over 2.5 hours per project.”


Yes! Reports is a new feature providing interactive dashboards for real-time visibility into your team’s research operations. From tracking budgets to monitoring activity and impact, they consolidate your most important metrics into three comprehensive views. Keep a pulse on activity, spend, and impact across the organization all from inside the app.
Reports make it easy for research operations managers to prove research impact, manage incentive budgets, and keep leadership informed of what research is happening across the organization. Built for teams operating at scale, access to research data supports good governance, provides visibility across the entire research pipeline, and helps to drive data-driven decision-making.
Absolutely. Reports update in real time, pulling the latest data from across your organization’s account so you’re never looking at outdated information. This means you can make decisions based on what’s actually happening right now, not last quarter.
All your spend, activity, and impact metrics live in one centralized dashboard, so you always have context at your fingertips. You can filter data by different time periods, and drill down to project-level and user-level insights.
If you need to conduct further analysis, no problem. All data can be easily exported and shared.
Because they need a clear, credible way to show research impact. With Reports, teams can track budgets, monitor activity, and measure outcomes in one place, making it easy to connect the dots between research investment and results.
Research Operations managers, in particular, find our reports helpful for visibility over the enterprise-wide research practice, plus the granular data they need to spot risks and opportunities to improve research effectiveness.
Turn messy data into a crystal-clear case for research with User Interviews.
Explore pricing


Schedule your demo and see us in action today.
