down arrow

The UX ROI & Impact Calculator

Use our UX ROI & Impact Calculator before or after any research project to receive a calculated return on your investment and see how you’re making a financial impact. Submit your email to unlock deeper analysis and get ROI resources sent straight to your inbox.

illustration collection of a multicolored calculator and person solving an equation

How the ROI calculator works

The UX ROI & Impact Calculator helps you answer a burning question: what is the impact of my research?

"Calculating ROI isn't inherently a UX research function, but I think it makes sense for us to take the lead. Most UX researchers are familiar with the concept, but I often get questions about how to actually do it. They understand that ROI demonstrates how UX is a smart business decision by connecting better user experiences to stronger financial outcomes.

They also recognize that when done well, ROI demonstrates that UX isn’t just about making things look good or work better; it’s also about making money."

-Principal UX Researcher Trevor Calabro 

Our calculator is inspired by his 5-step framework originally featured in Fresh Views.

How this tool calculates ROI: A 5-Step Framework

Step 1: Identify the problem and establish benchmarks

The first step in any ROI calculation is identifying the specific problem you're trying to solve. What's inefficient, frustrating, or costly for your users or organization? Once the problem is clear, gather data to understand the current state of things and use it as benchmarks to measure improvements.

question mark icon
Key questions to ask:
  • What are the pain points or inefficiencies in the current experience?
  • How are these issues impacting users, support teams, or the business at large?
  • What data do you have access to establish a baseline (e.g., time spent, error rates, support calls, usability scorecards, conversion rates, etc.)?
star icon
Example benchmark:
In a file export workflow, a benchmark metric might be:
  • Average time users spend completing the workflow
  • Percentage of users encountering critical errors
  • Total support hours logged related to export issues

Step 2: Define goals and expected outcomes

Once you've identified the problem and established benchmarks, set clear, measurable goals for your project. These should reflect both user-centered improvements and business-facing outcomes.

eyes looking left icon
Key considerations:
  • What specific improvements do you aim to achieve (e.g., time savings, reduced errors, increased conversions, etc.)?
  • How do these improvements align with organizational goals, such as saving money or driving revenue? (It's almost always saving money or driving revenue. Hahahaha.)
soccer ball icon
Example goals:
  • Increase conversion rate from 5% to 10% (revenue)
  • Cut support calls by at least 15% (savings)
  • Increase feature adoption rate by 20% (revenue)

Step 3: Gather data to estimate ROI

With goals in mind, start collecting the organizational data you'll need to estimate the financial impact of your UX improvements. This involves quantifying both the Return (financial benefit) and the Investment (project costs).

check icon
What to include:
  • Current metrics: Baseline data collected in Step 1.
  • Projected improvements: Expected changes based on research, competitor benchmarks, or past projects.
  • Costs: Total project expenses, such as participant recruitment, team hours, and development costs.
upward line graph icon
Example data points:
  • User time savings due to a simplified workflow
  • Fewer support hours needed because of reduced errors
  • Costs associated with the redesign (e.g., the cumulative cost of the UX efforts involved)

Tracking UX's time is critical for calculating ROI. It's a merit-based method that keeps UXers accountable, creating a virtuous cycle of responsibility and fostering high work quality.

Step 4: Calculate ROI and convert to money

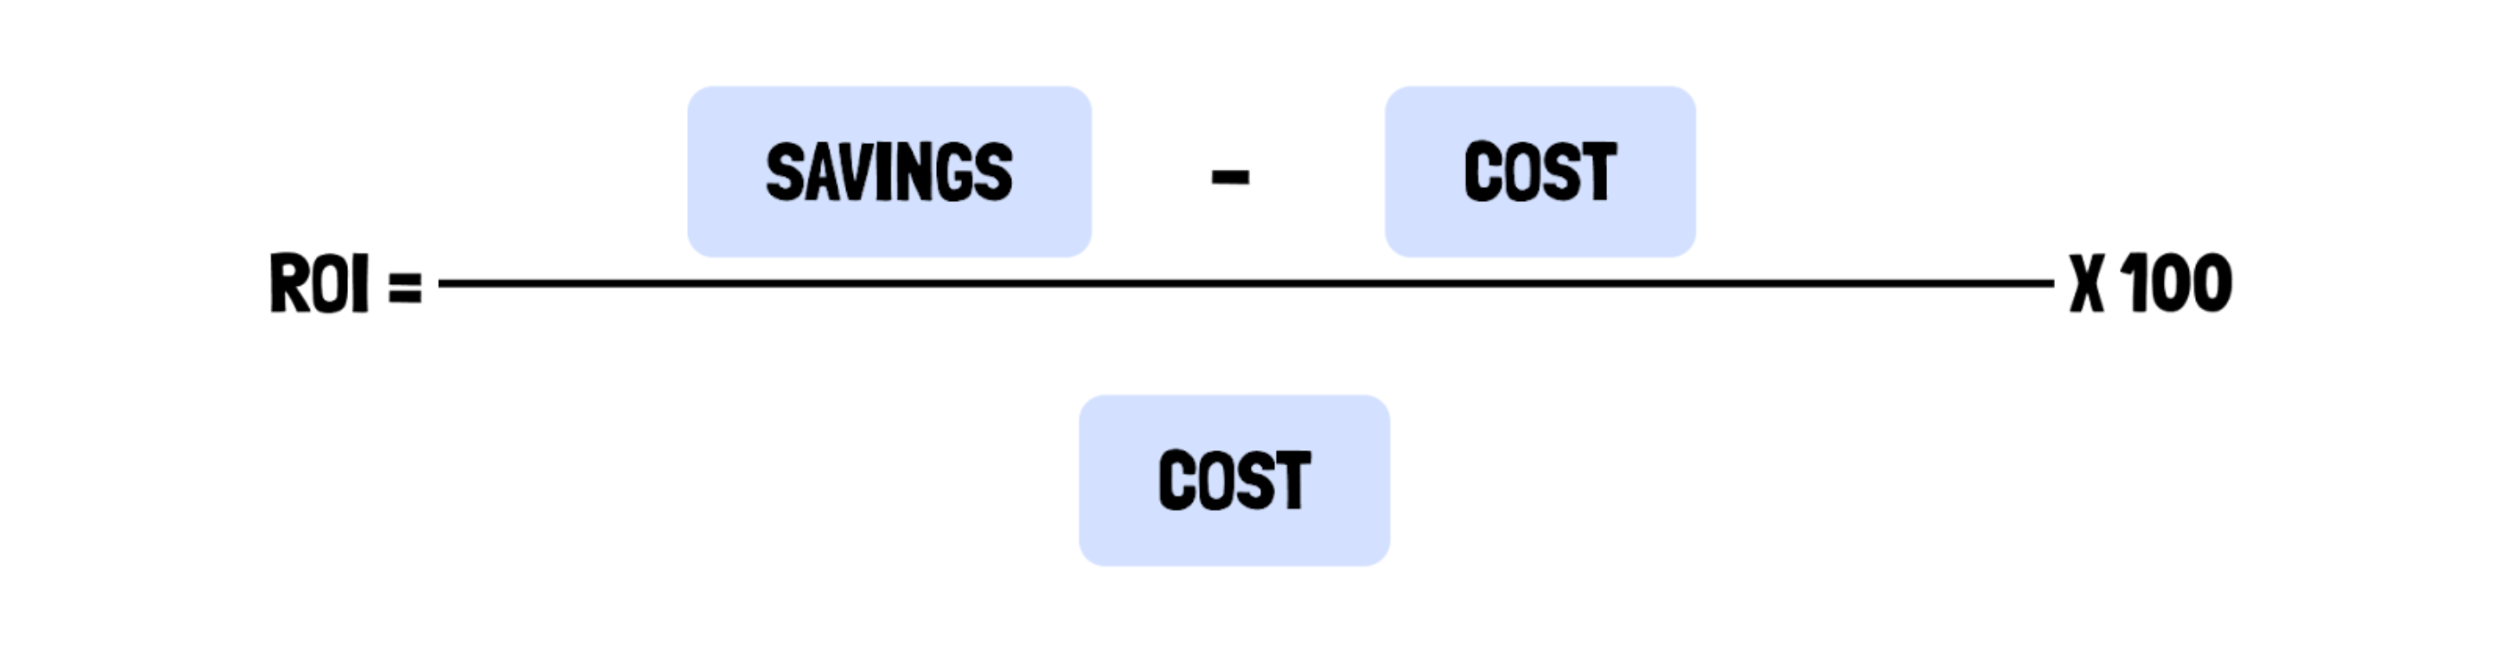
Once you have that stuff, it's time to perform the calculations. Use the standard ROI formula:

calculation that reads: ROI = (savings minus cost) over cost, all times 100
puzzle pieces icon
Break it into smaller steps if needed:
  1. Calculate user time savings or revenue increases.
  2. Quantify operational savings, such as reduced support costs.
  3. Add these together to determine the total benefit (Return).
  4. Subtract the project cost (Investment) and plug the numbers into the formula.

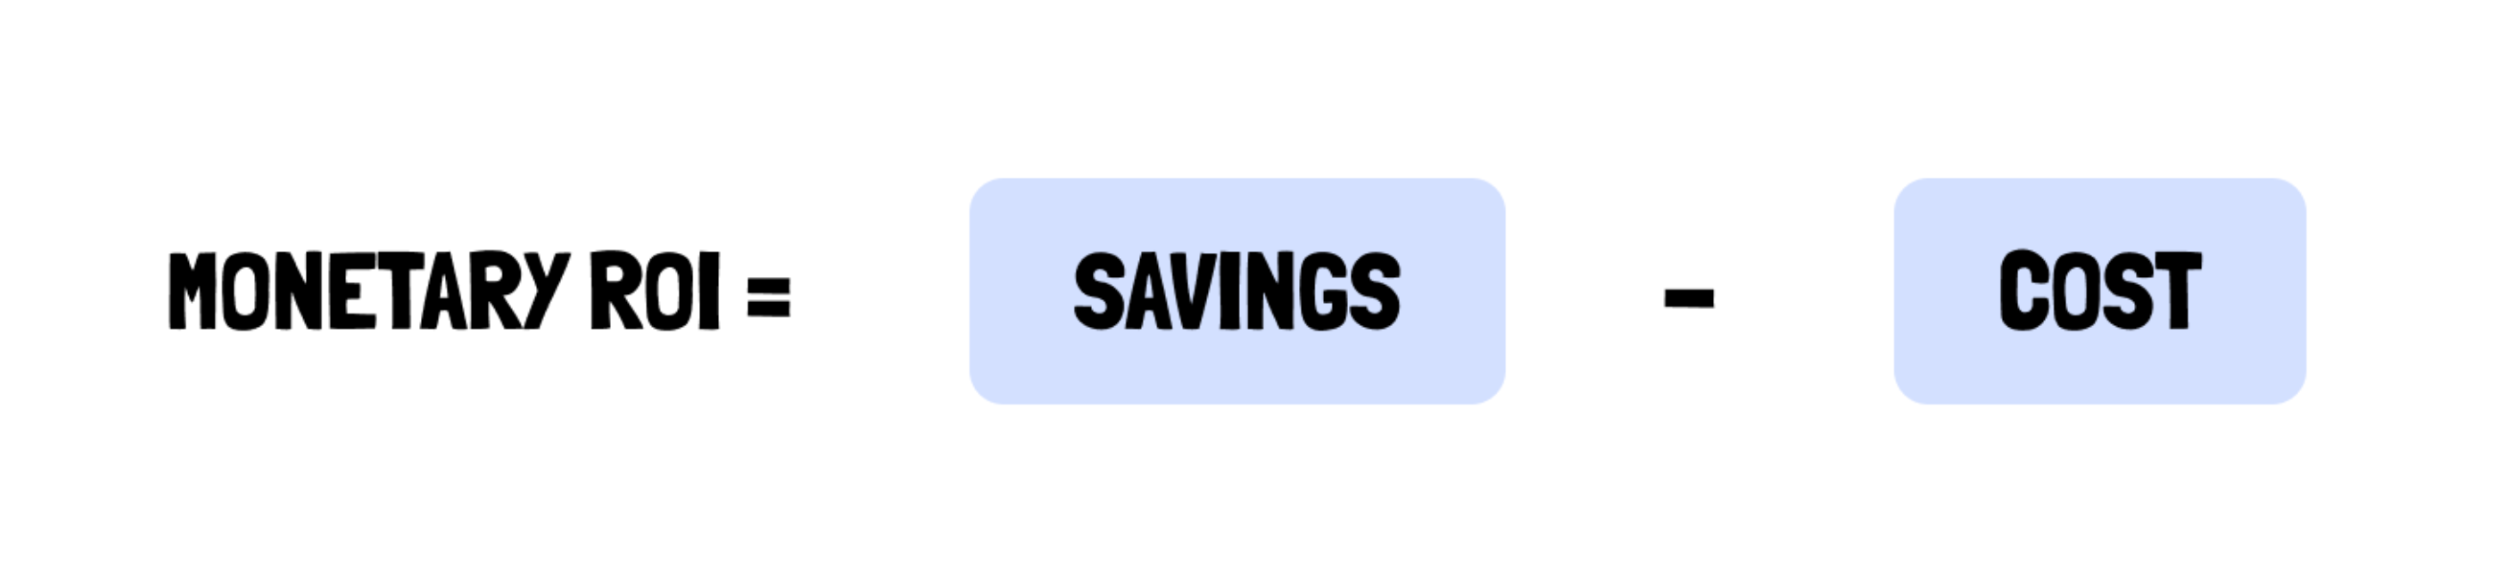
Finally, once you have your ROI percentage, convert that to money. Use the standard conversion formula:

calculation that reads: monetary ROI = savings minus cost

Step 5: Communicate results effectively

The final step is sharing your findings in a responsible way that resonates with your audience. Most stakeholders care about financial outcomes, so focus on the metrics that align with their priorities. Use visuals and clear language to tell a compelling story.

stars icon
Tips for presenting ROI:
  • Start with the problem: What issue did we address, and why did it matter?
  • Highlight key metrics: Time saved, cost reductions, revenue generated, etc.
  • Be transparent: Share your assumptions, limitations, and calculations. (more on this later)

Example summary for stakeholders

  • By redesigning this workflow, we're projected to save ~5,000 user hours and ~320 support hours each month, resulting in an annual ROI of 882.7%.
  • After adjusting for the internal spend of the team's effort, this equates to ~$660,000 in net annual benefits. This means, with a project cost of ~$75,000, the redesign delivers a net monetary benefit of $585,000 annually.
  • For every dollar spent on the project, the company gains ~$8.80 in return. These improvements are predicted to improve user satisfaction and also deliver a new revenue stream.

Participant recruitment that’s unbelievably fast

Launch in minutes, source in hours, complete your study in days. Get detailed feedback and quality insights from our top-rated pool of over 6 million users.

Sign up free
an illustrated figure with an oversized magnifying glass looking at documents