
Who is this article for?
🗣️ All researchers (both admins and users)
⭐ Teams on any User Interviews plan
Our built-in AI Insights & Analysis tools help you organize conversations into structured observations, compare participants side by side, surface evidence faster, and share insights more clearly. Every claim links back to real participant quotes, so it’s easy to verify accuracy and context.
✨To use these capabilities, first make sure AI features and auto-recording are enabled for your team.
Generating Session Breakdowns
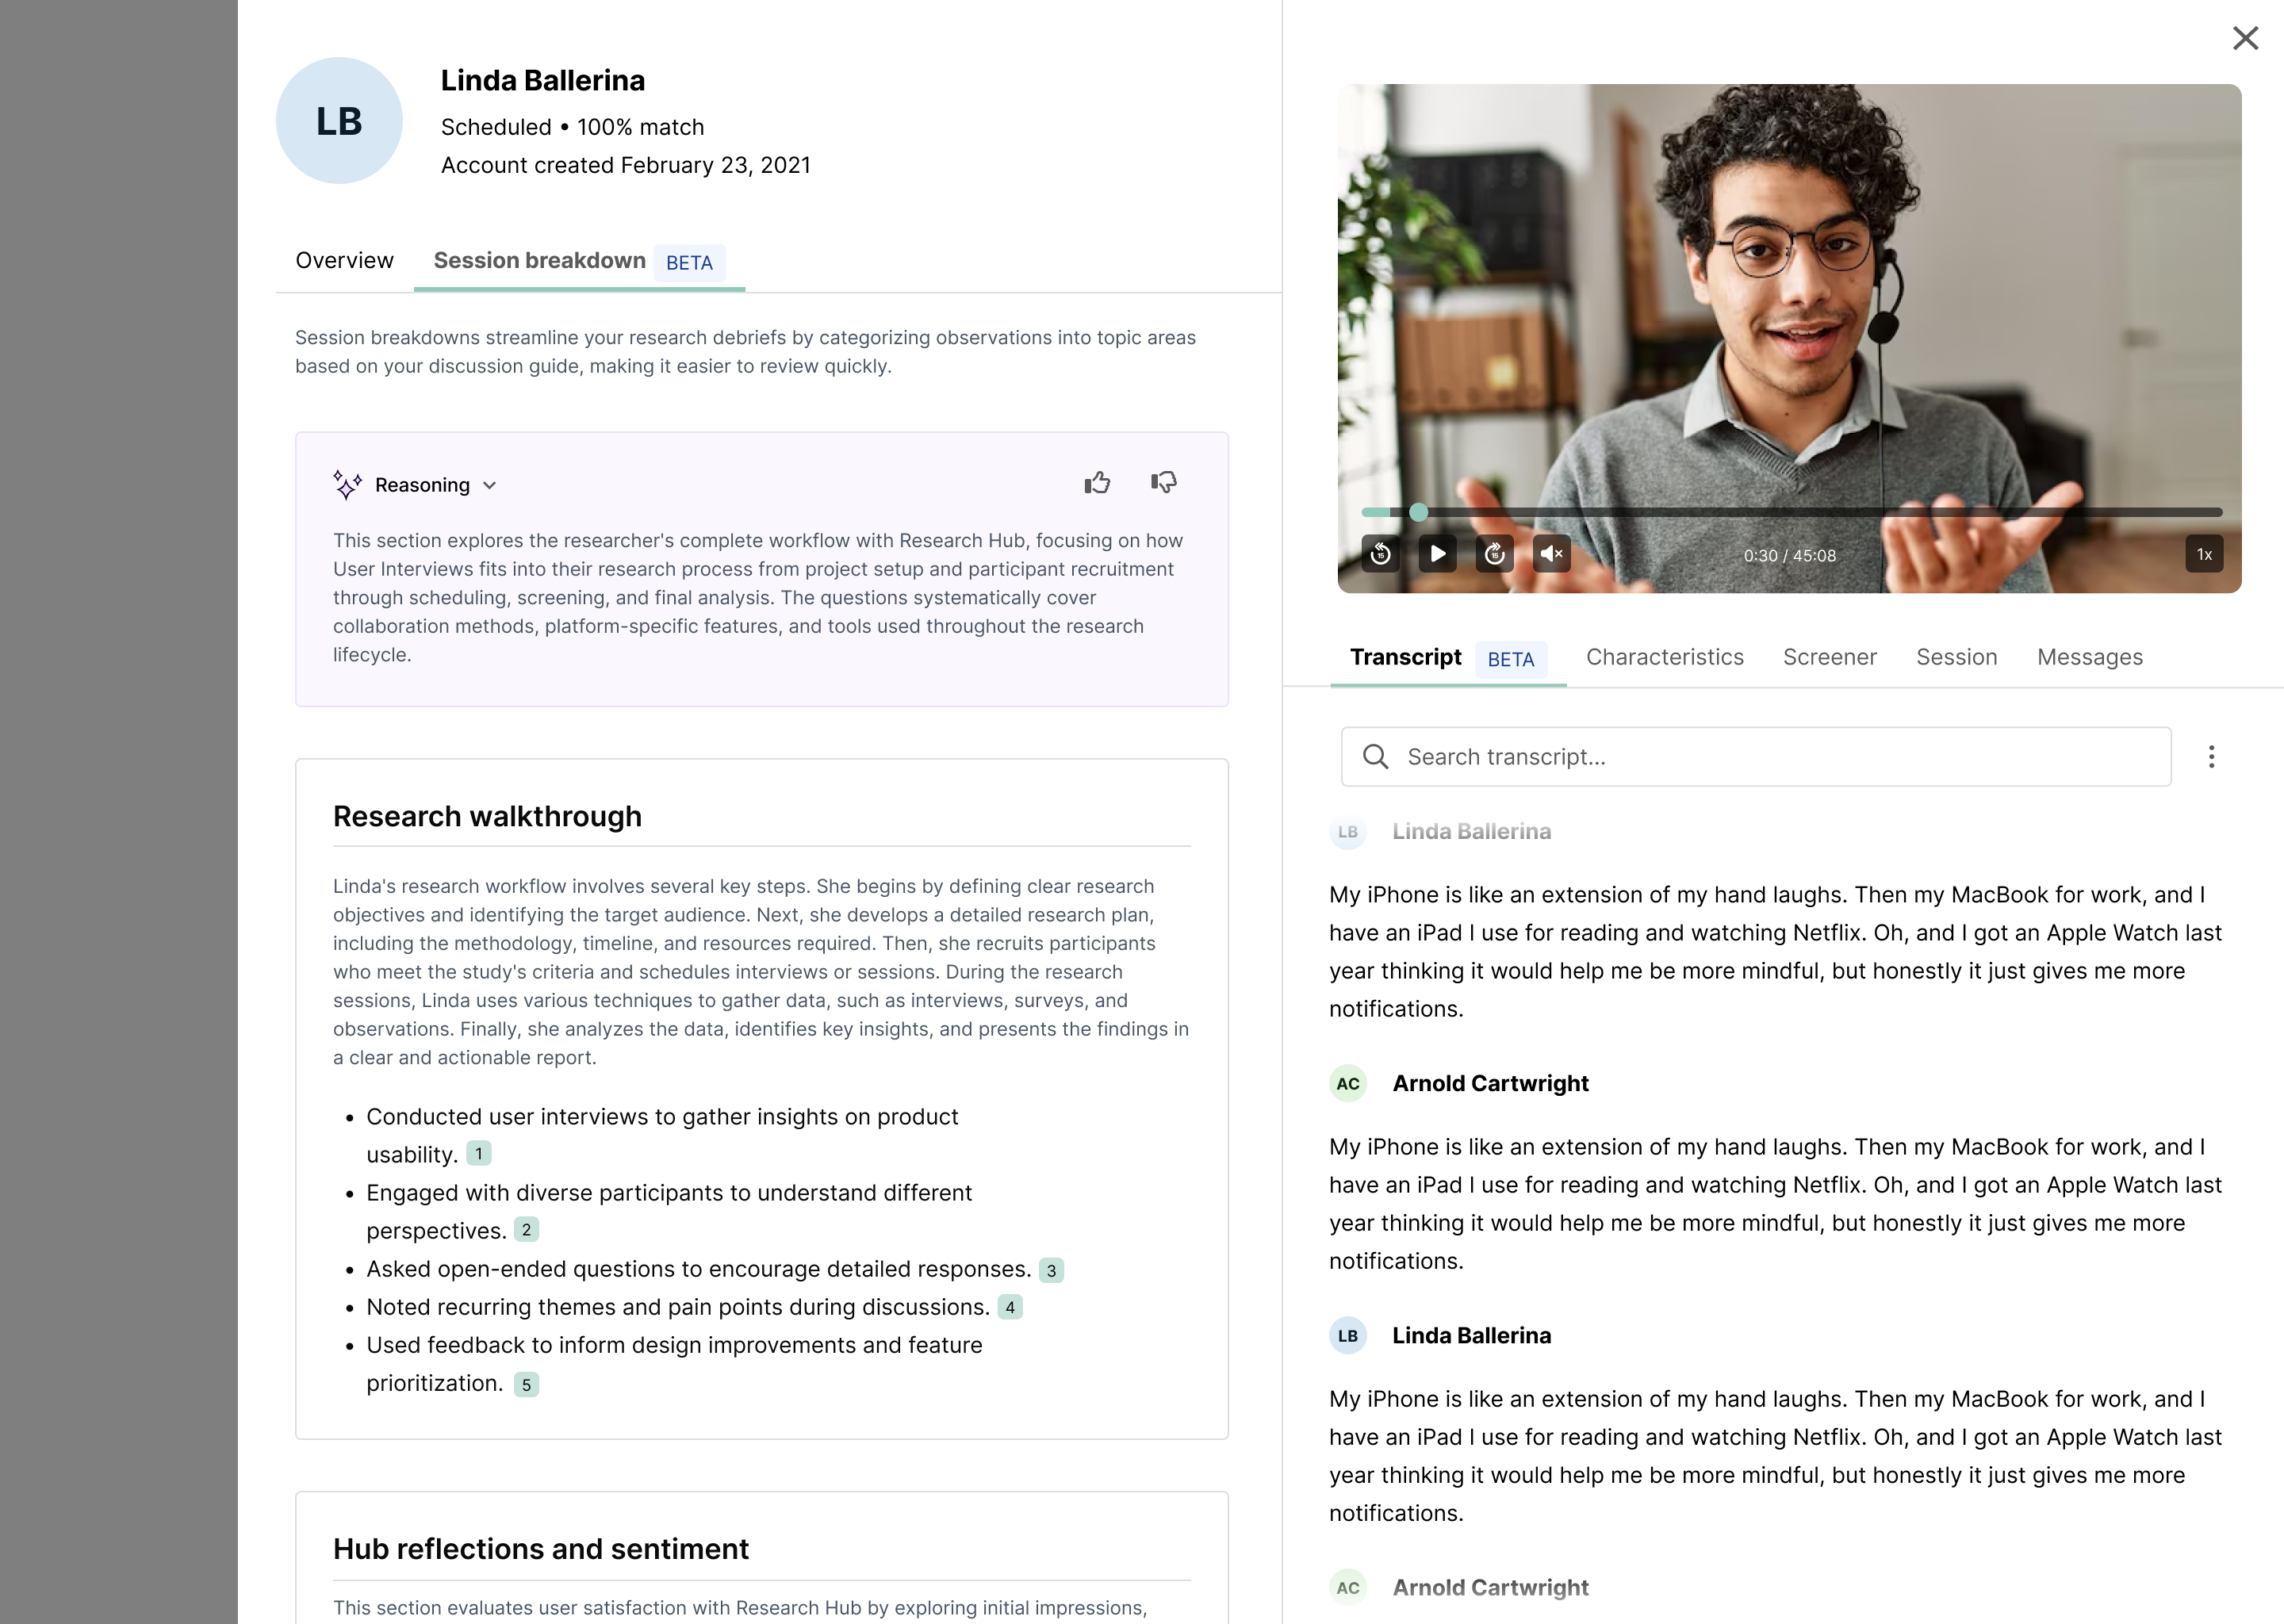
The session breakdown speeds up the research review process by categorizing key observations into topic areas based on your discussion guide. Every observation has citations and links directly to its source quote(s) from the transcript for additional review or context.
How it works
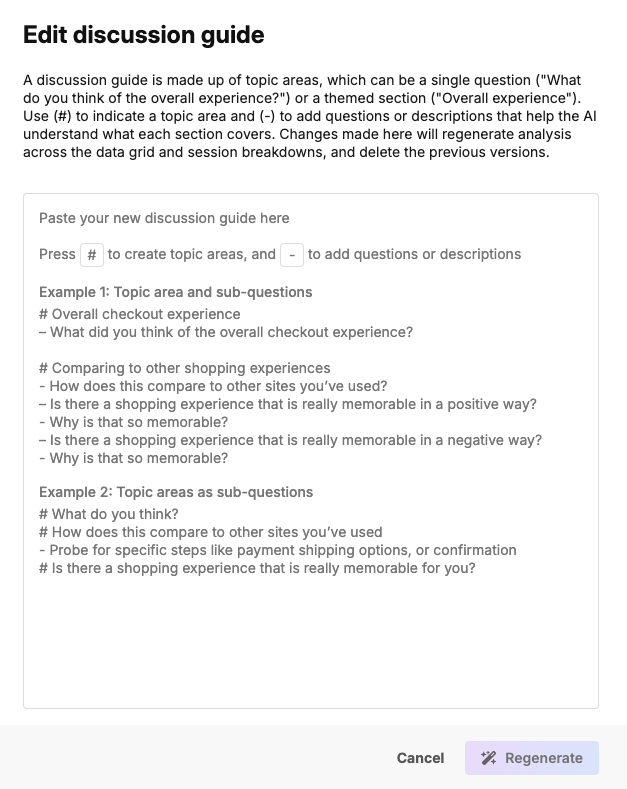
Upload your discussion guide to any session, and it will apply to all sessions across the project. There are two ways to upload your discussion guide:
1. Via the Analysis Tab:
- Go to the Research Analysis tab of your project and click “Add discussion guide.”
- A form will appear where you can paste your discussion guide.
- Paste your guide into the text area and click “Generate.”
2. Via the Session Breakdown:
- Go to the Participant Management > Completed Sessions section of your project workspace and click open the session you want to analyze.
- Go to the Session Breakdown tab and click “add discussion guide.”
- Simply copy and paste your discussion guide into the textbox, and then click “Generate.”
How session breakdowns are generated
Based on your discussion guide, our AI Assistant will create learning topic areas and organize participant quotes into structured observations, linking every observation directly back to its source quotes.
Each observation will include:
- One or more citations
- Clickable links to transcript timestamps
Note that session breakdowns are structured observations, not final insights — use them as a starting point for synthesis, and then apply your research judgment: check the citations to review the context for each observation, and edit, refine, or discard observations as needed.
You can update your discussion guide anytime so your analysis stays aligned as your research questions evolve. Just paste in an updated version of your discussion guide, click regenerate, and your session breakdowns and data grid will update automatically.
How to turn observations into sharable insights
From a session breakdown, you can:
- Pull quotes
- Create clips
- Share early learnings
- Copy any observation with one click
To create a clip, highlight text on the transcript or data grid, click “Clip”, and this will instantly create a saved clip that you can easily reference or share with your team. You can view all your saved clips in the Clips tab. This brings together clips from every participant in one place for easy review.

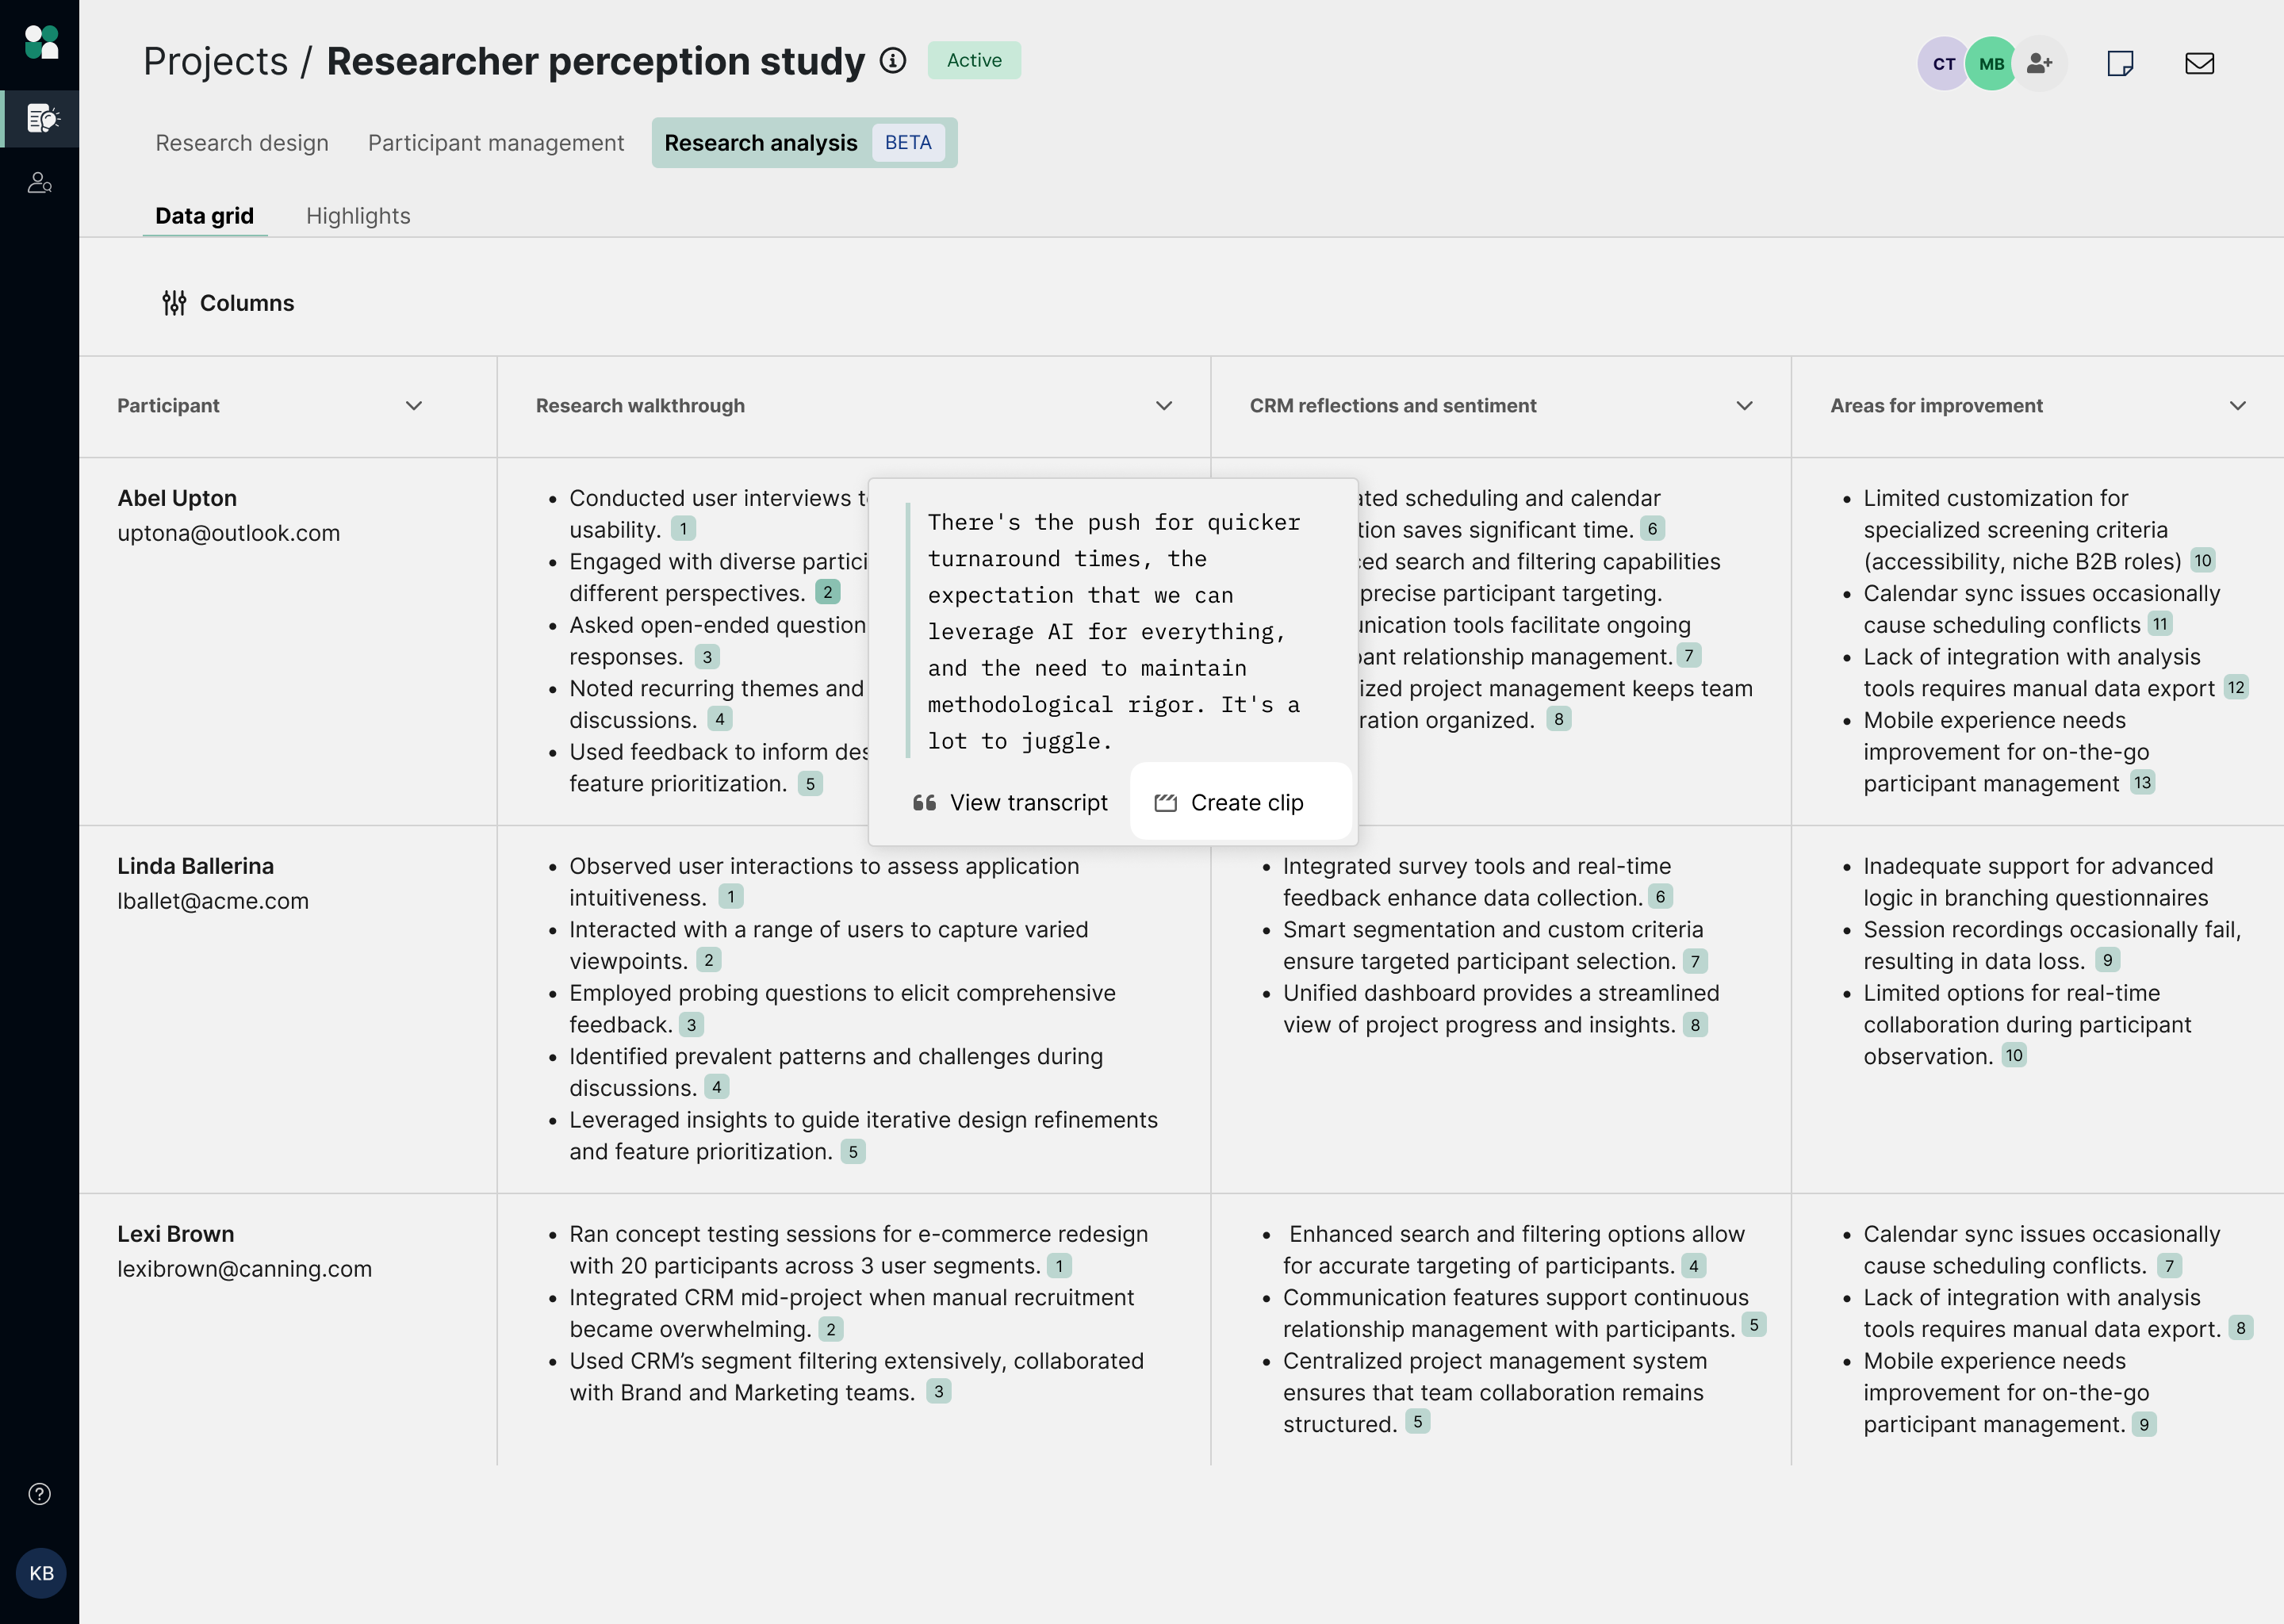
Analysis with the Data grid
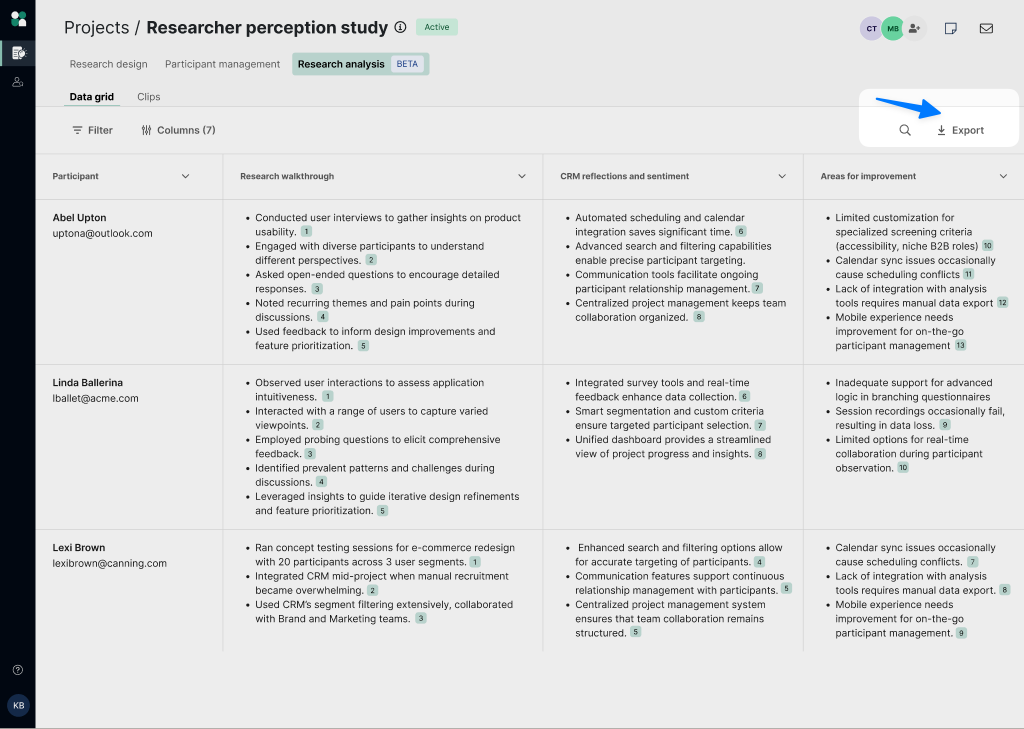
The Data grid allows you to easily compare key observations across participants—integrated with the context of other participant data—all in one place. It’s designed to feel intuitive, while keeping every insight directly connected to source material. The layout looks like this:
- Rows represent an individual participant in your project
- Columns display discussion topics, generated from your discussion guide.
- Cells contain AI-generated observations with clickable citations.
As sessions complete, the grid updates automatically. You can use the grid to scan a topic column to identify themes, spot outliers or contradictions, or validate patterns by jumping to source quotes. Because everything is linked back to transcripts, it’s easy to confirm accuracy.
Watch it in Action
How it works
- First, make sure AI features are enabled for your team
- Enable your recorder bot and complete your 1:1 moderated session
- Upload your discussion guide to generate the session breakdown
- Use the data grid to view & compare insights all in one place
- Layer in additional audience data for richer context and deeper analysis

Every insight is traceable and linked directly back to its original source material. Clicking on the citations will open the relevant transcript and jump to the specific quotes the observation was generated from. You can also copy observations in one click and paste into other tools for further analysis.

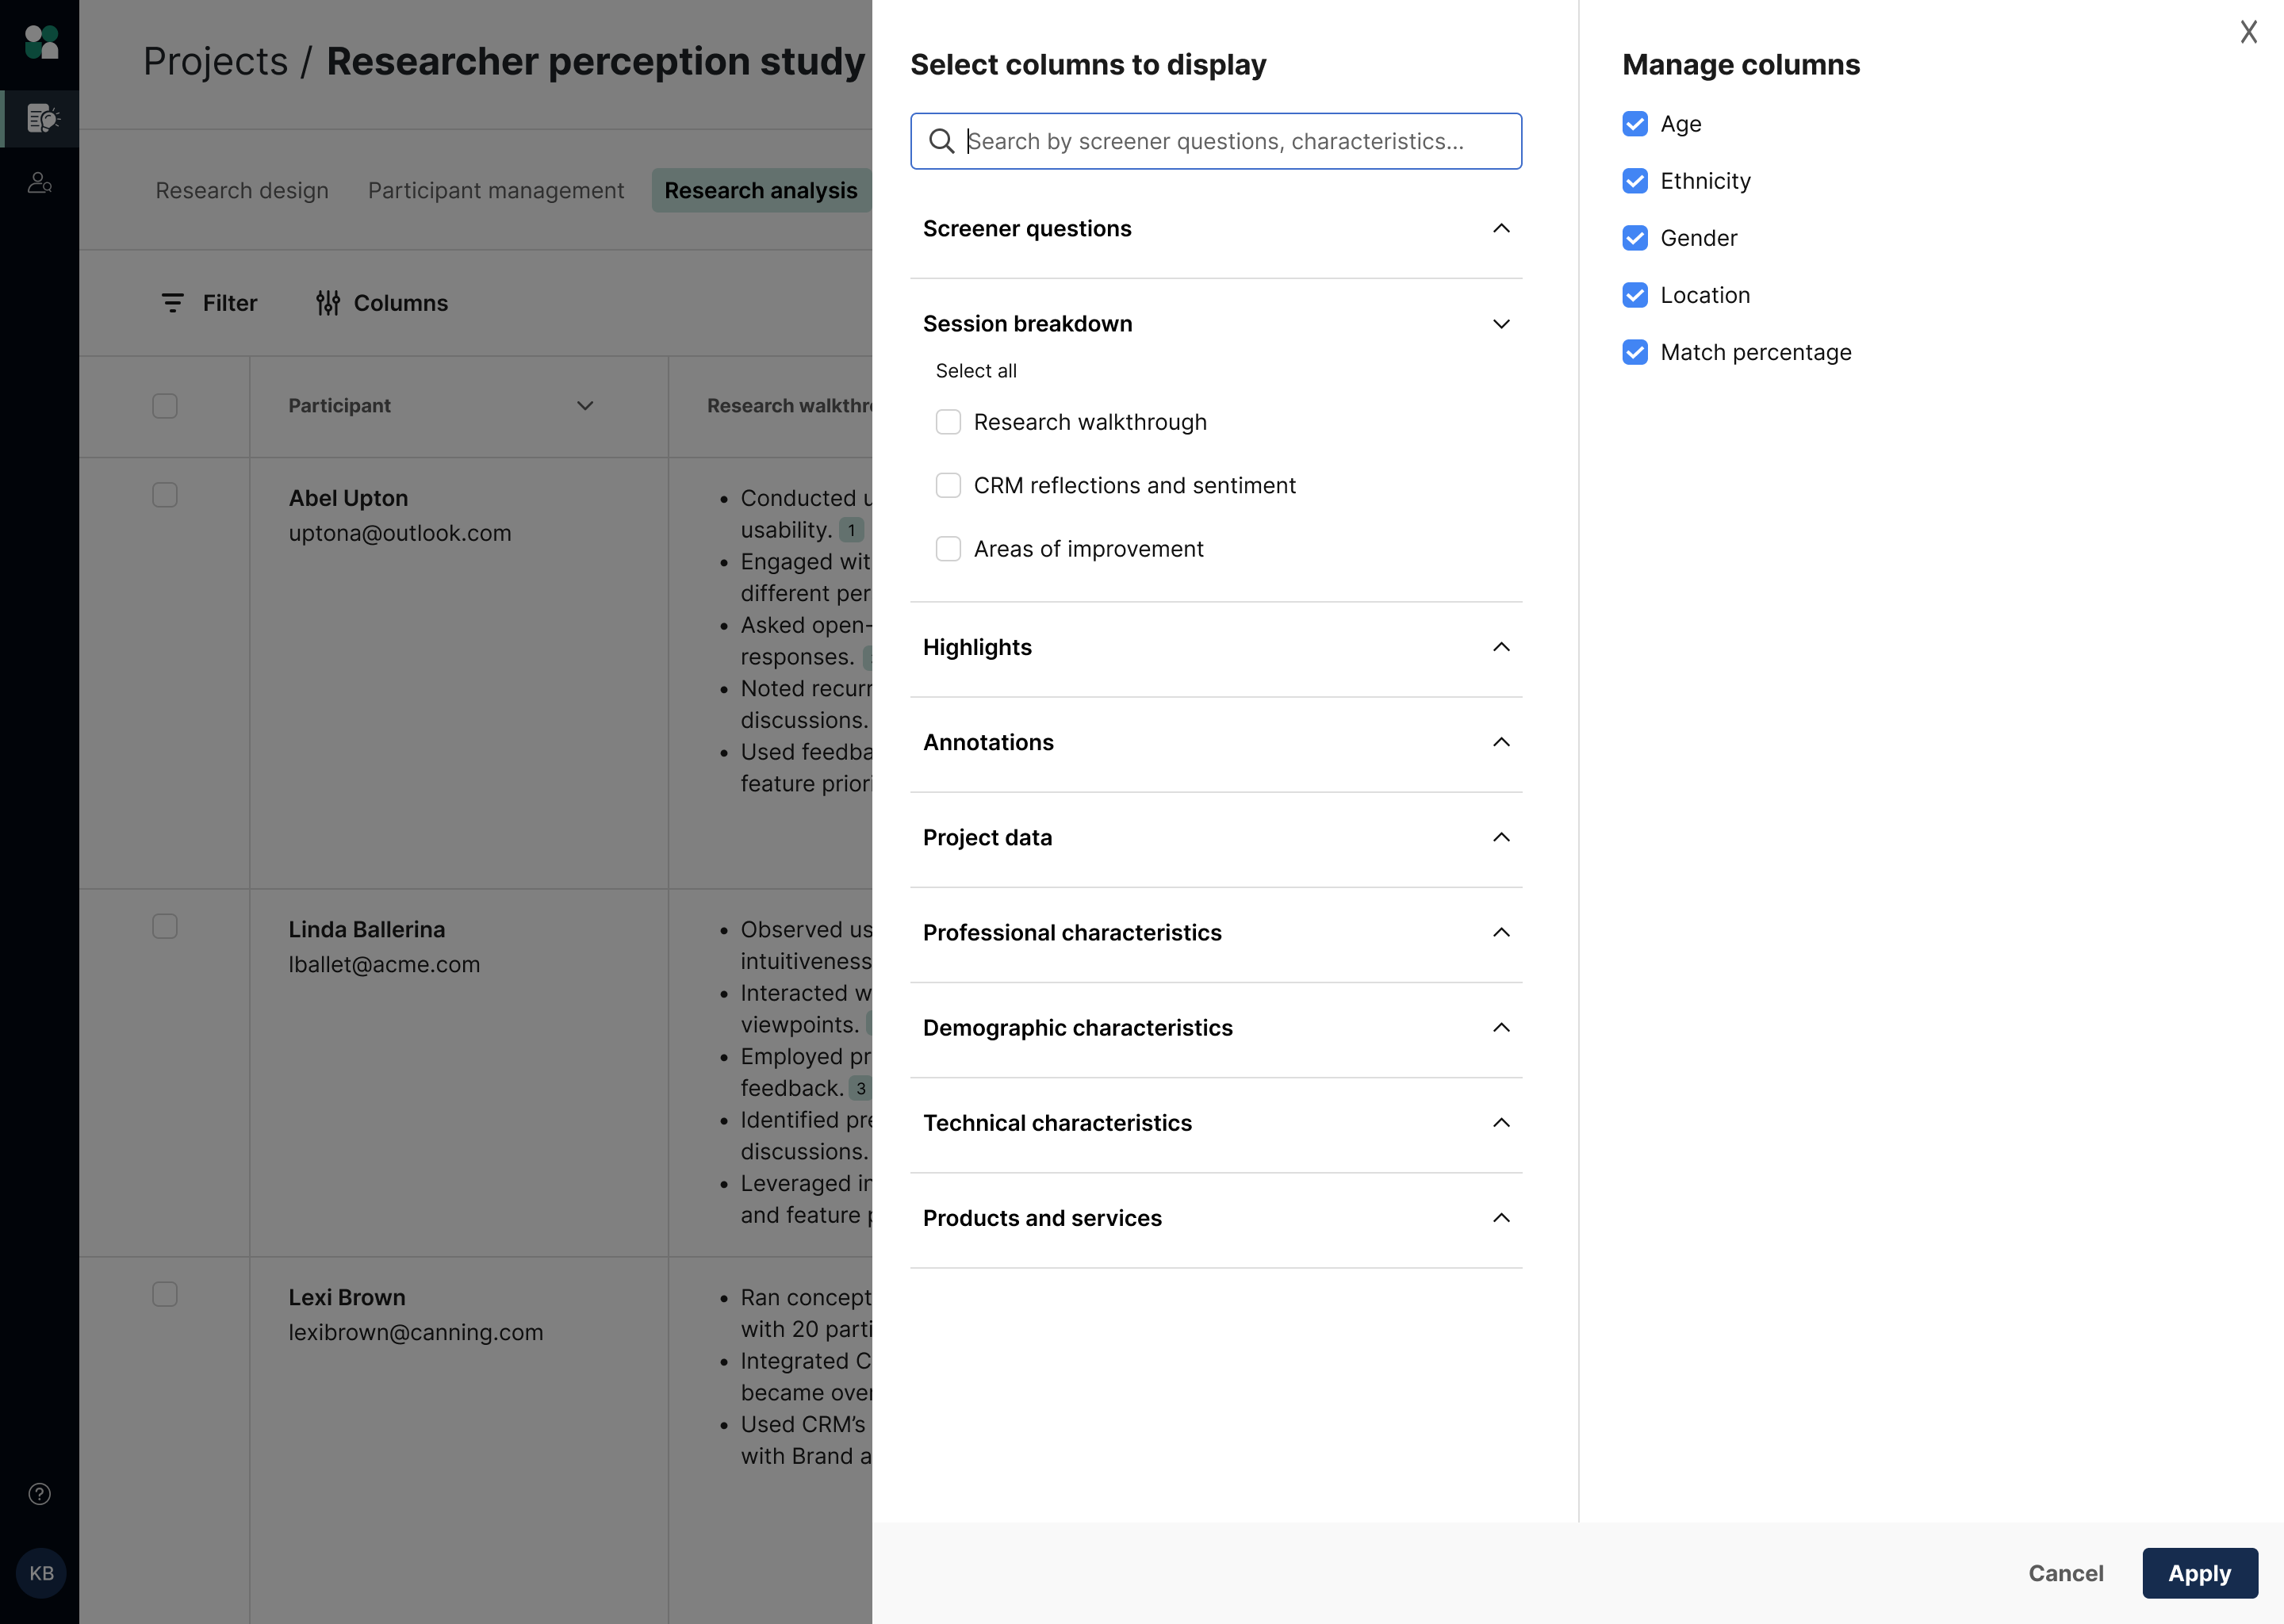
Add additional project and participant data to the data grid if you want to pull in more information to use in your analysis—such as screener responses, characteristics, and more.
Exporting your data grid
To bring this data into spreadsheets or other tools, you can download the entire data grid as a csv file. All of the automatically generated information from the session breakdowns will be included in your export—tags, summary, sentiment, and any custom columns you have added.
Exporting is simple:
- Navigate to the Data Grid tab in your workspace.
- Use the dropdown to select “Export.”
- Download the generated CSV file
The CSV export includes:
- Participant name
- Participant email
- All AI-generated observation columns (based on discussion topics)
Currently, exports do NOT include:
- Screener responses
- Custom participant fields
- Citation links
Creating Clips
Use Clips to capture and share key video moments from your recorded sessions with stakeholders. Unlike generic screen recordings or manually trimmed videos, clips in User Interviews are:
- Automatically tied to the participant
- Linked directly to transcript context
- Anchored to exact timestamps
- Connected to your broader analysis
How to create clips
You can create clips from three places within your project:
- From transcript highlights: When reviewing your transcript, highlight text directly in the transcript and click “clip.” The clip is automatically saved and timestamped.
- From session breakdown observations: From the sessions breakdown tab, simply click the citation number attached to an observation and select “create clip.”
- From data grid citations: When working with the data grid, click into a grid cell, open the citation, and create a clip.
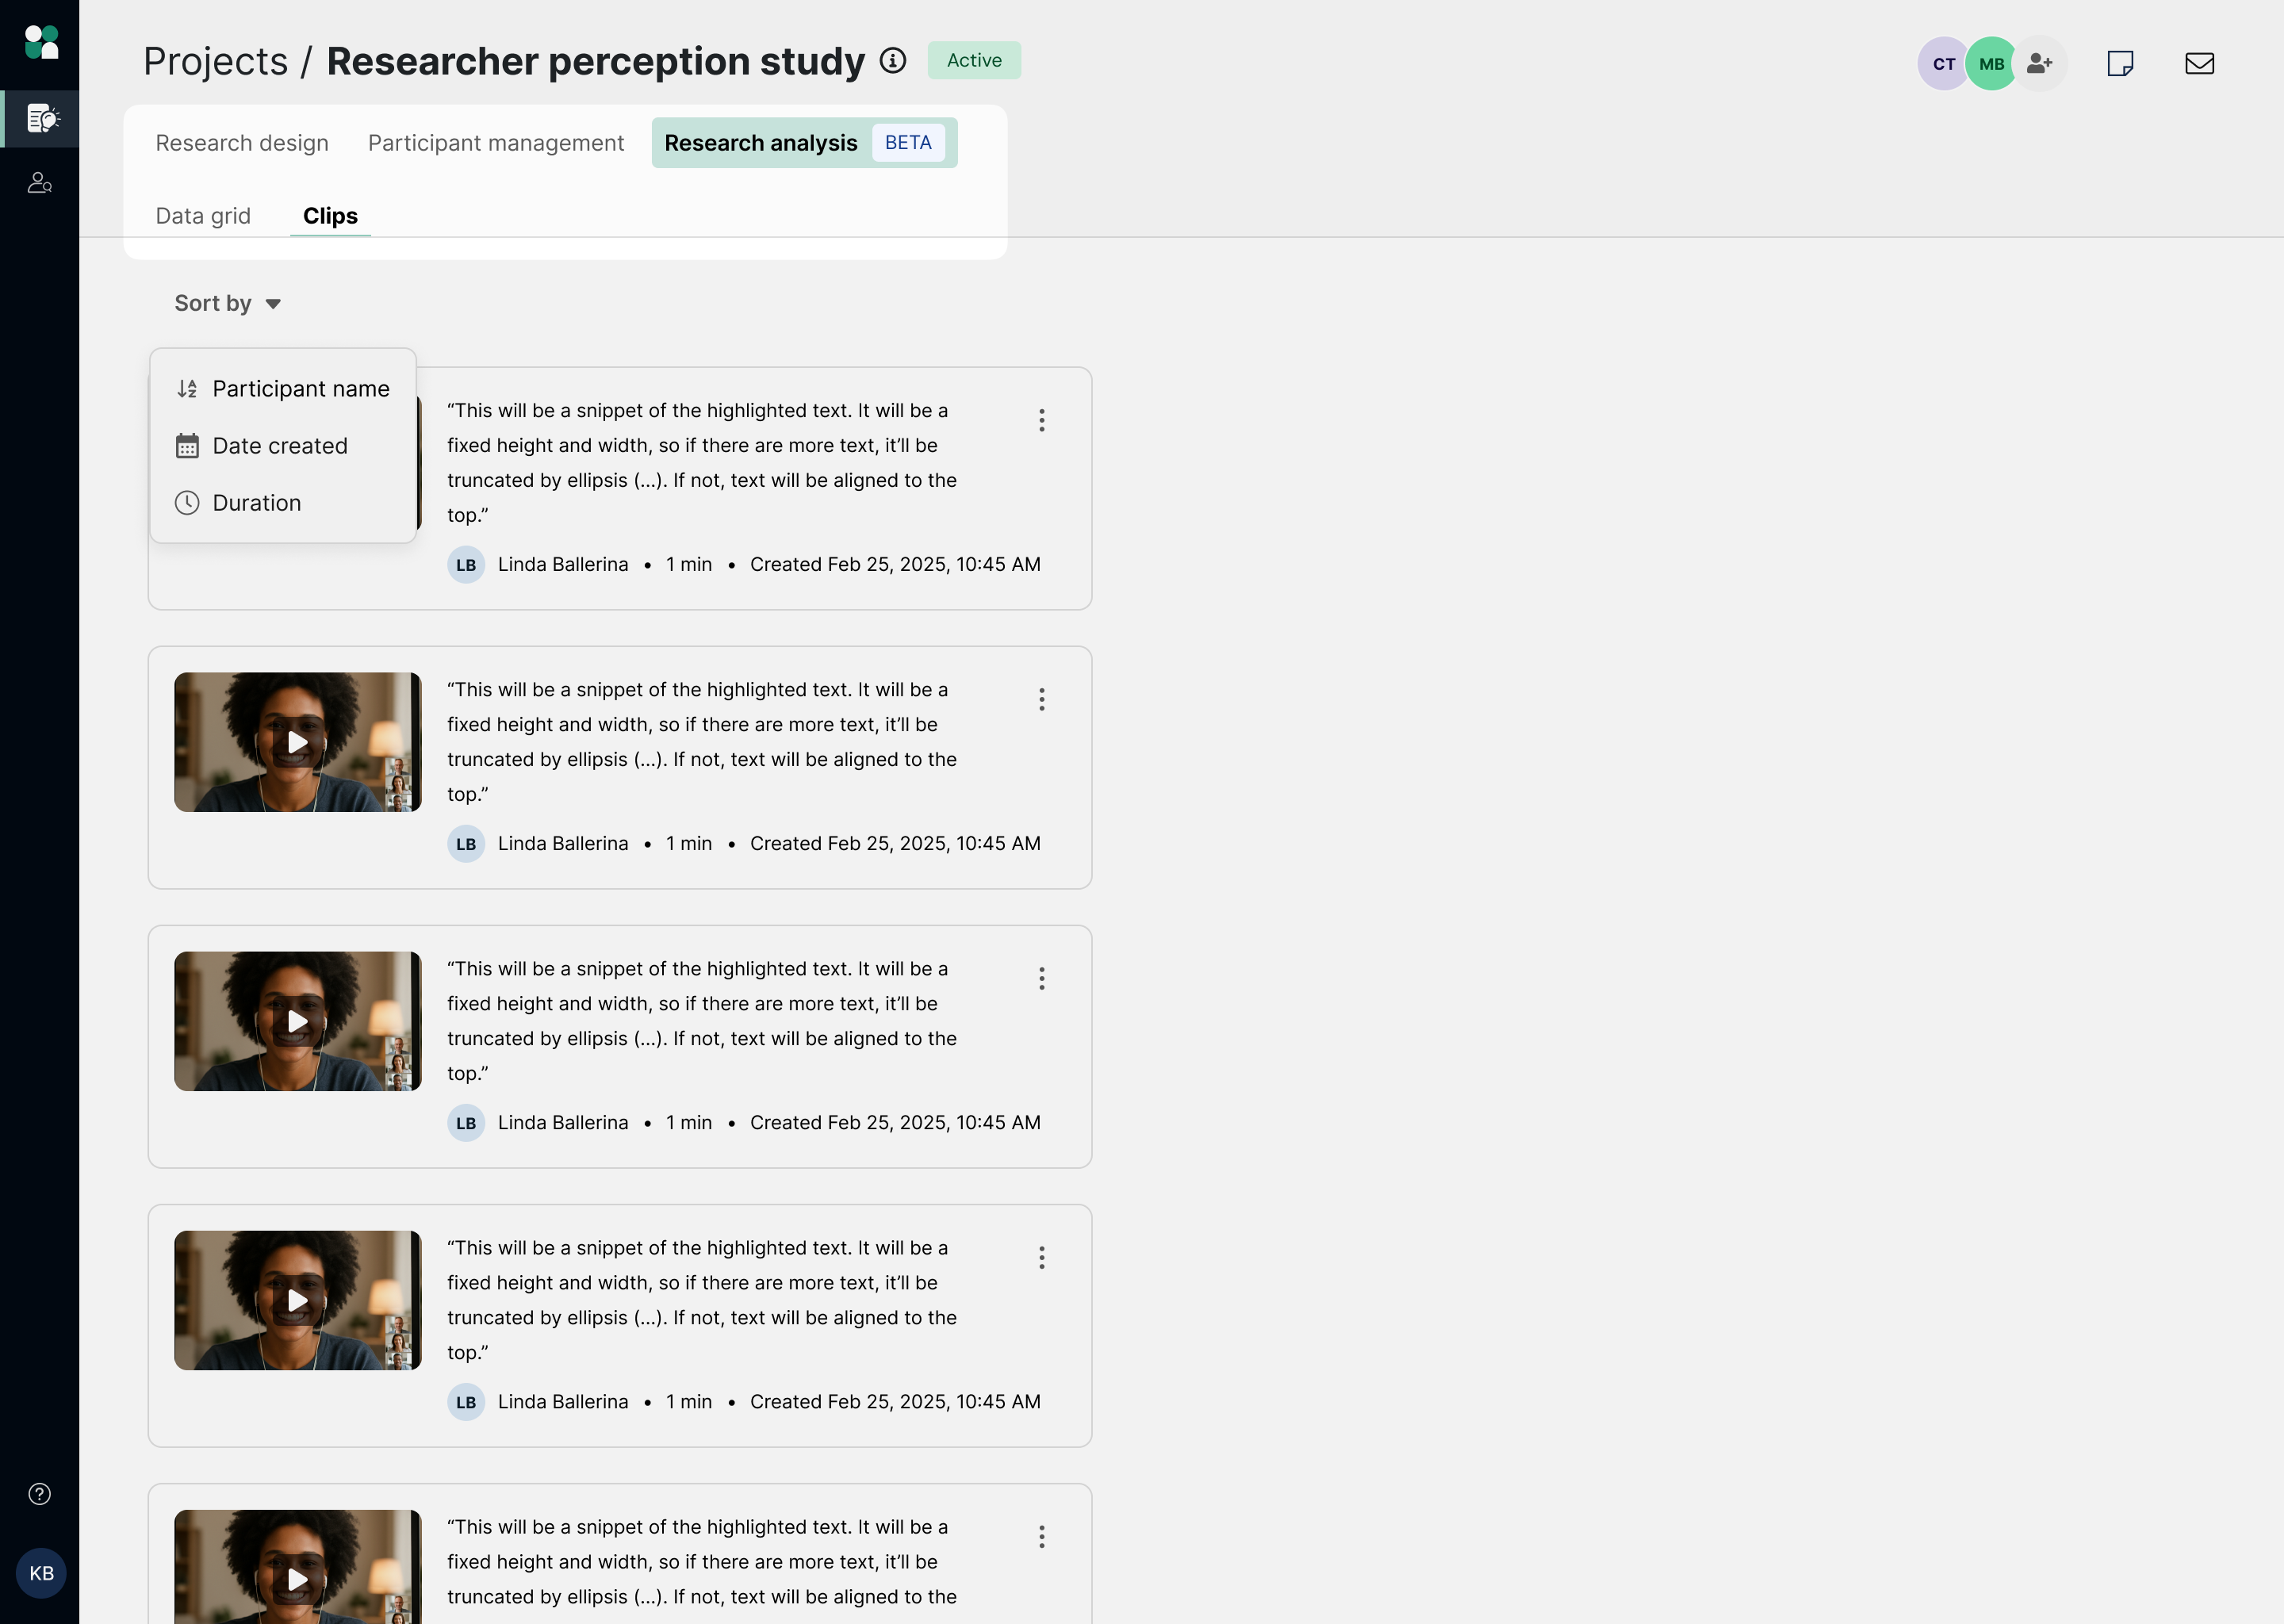
Organizing, managing, and sharing clips
All clips appear in the Clips tab within the Research Analysis section of your project. From there, you can:
- Review clips across all participants
- Sort by date created or duration
- Revisit evidence as you finalize themes
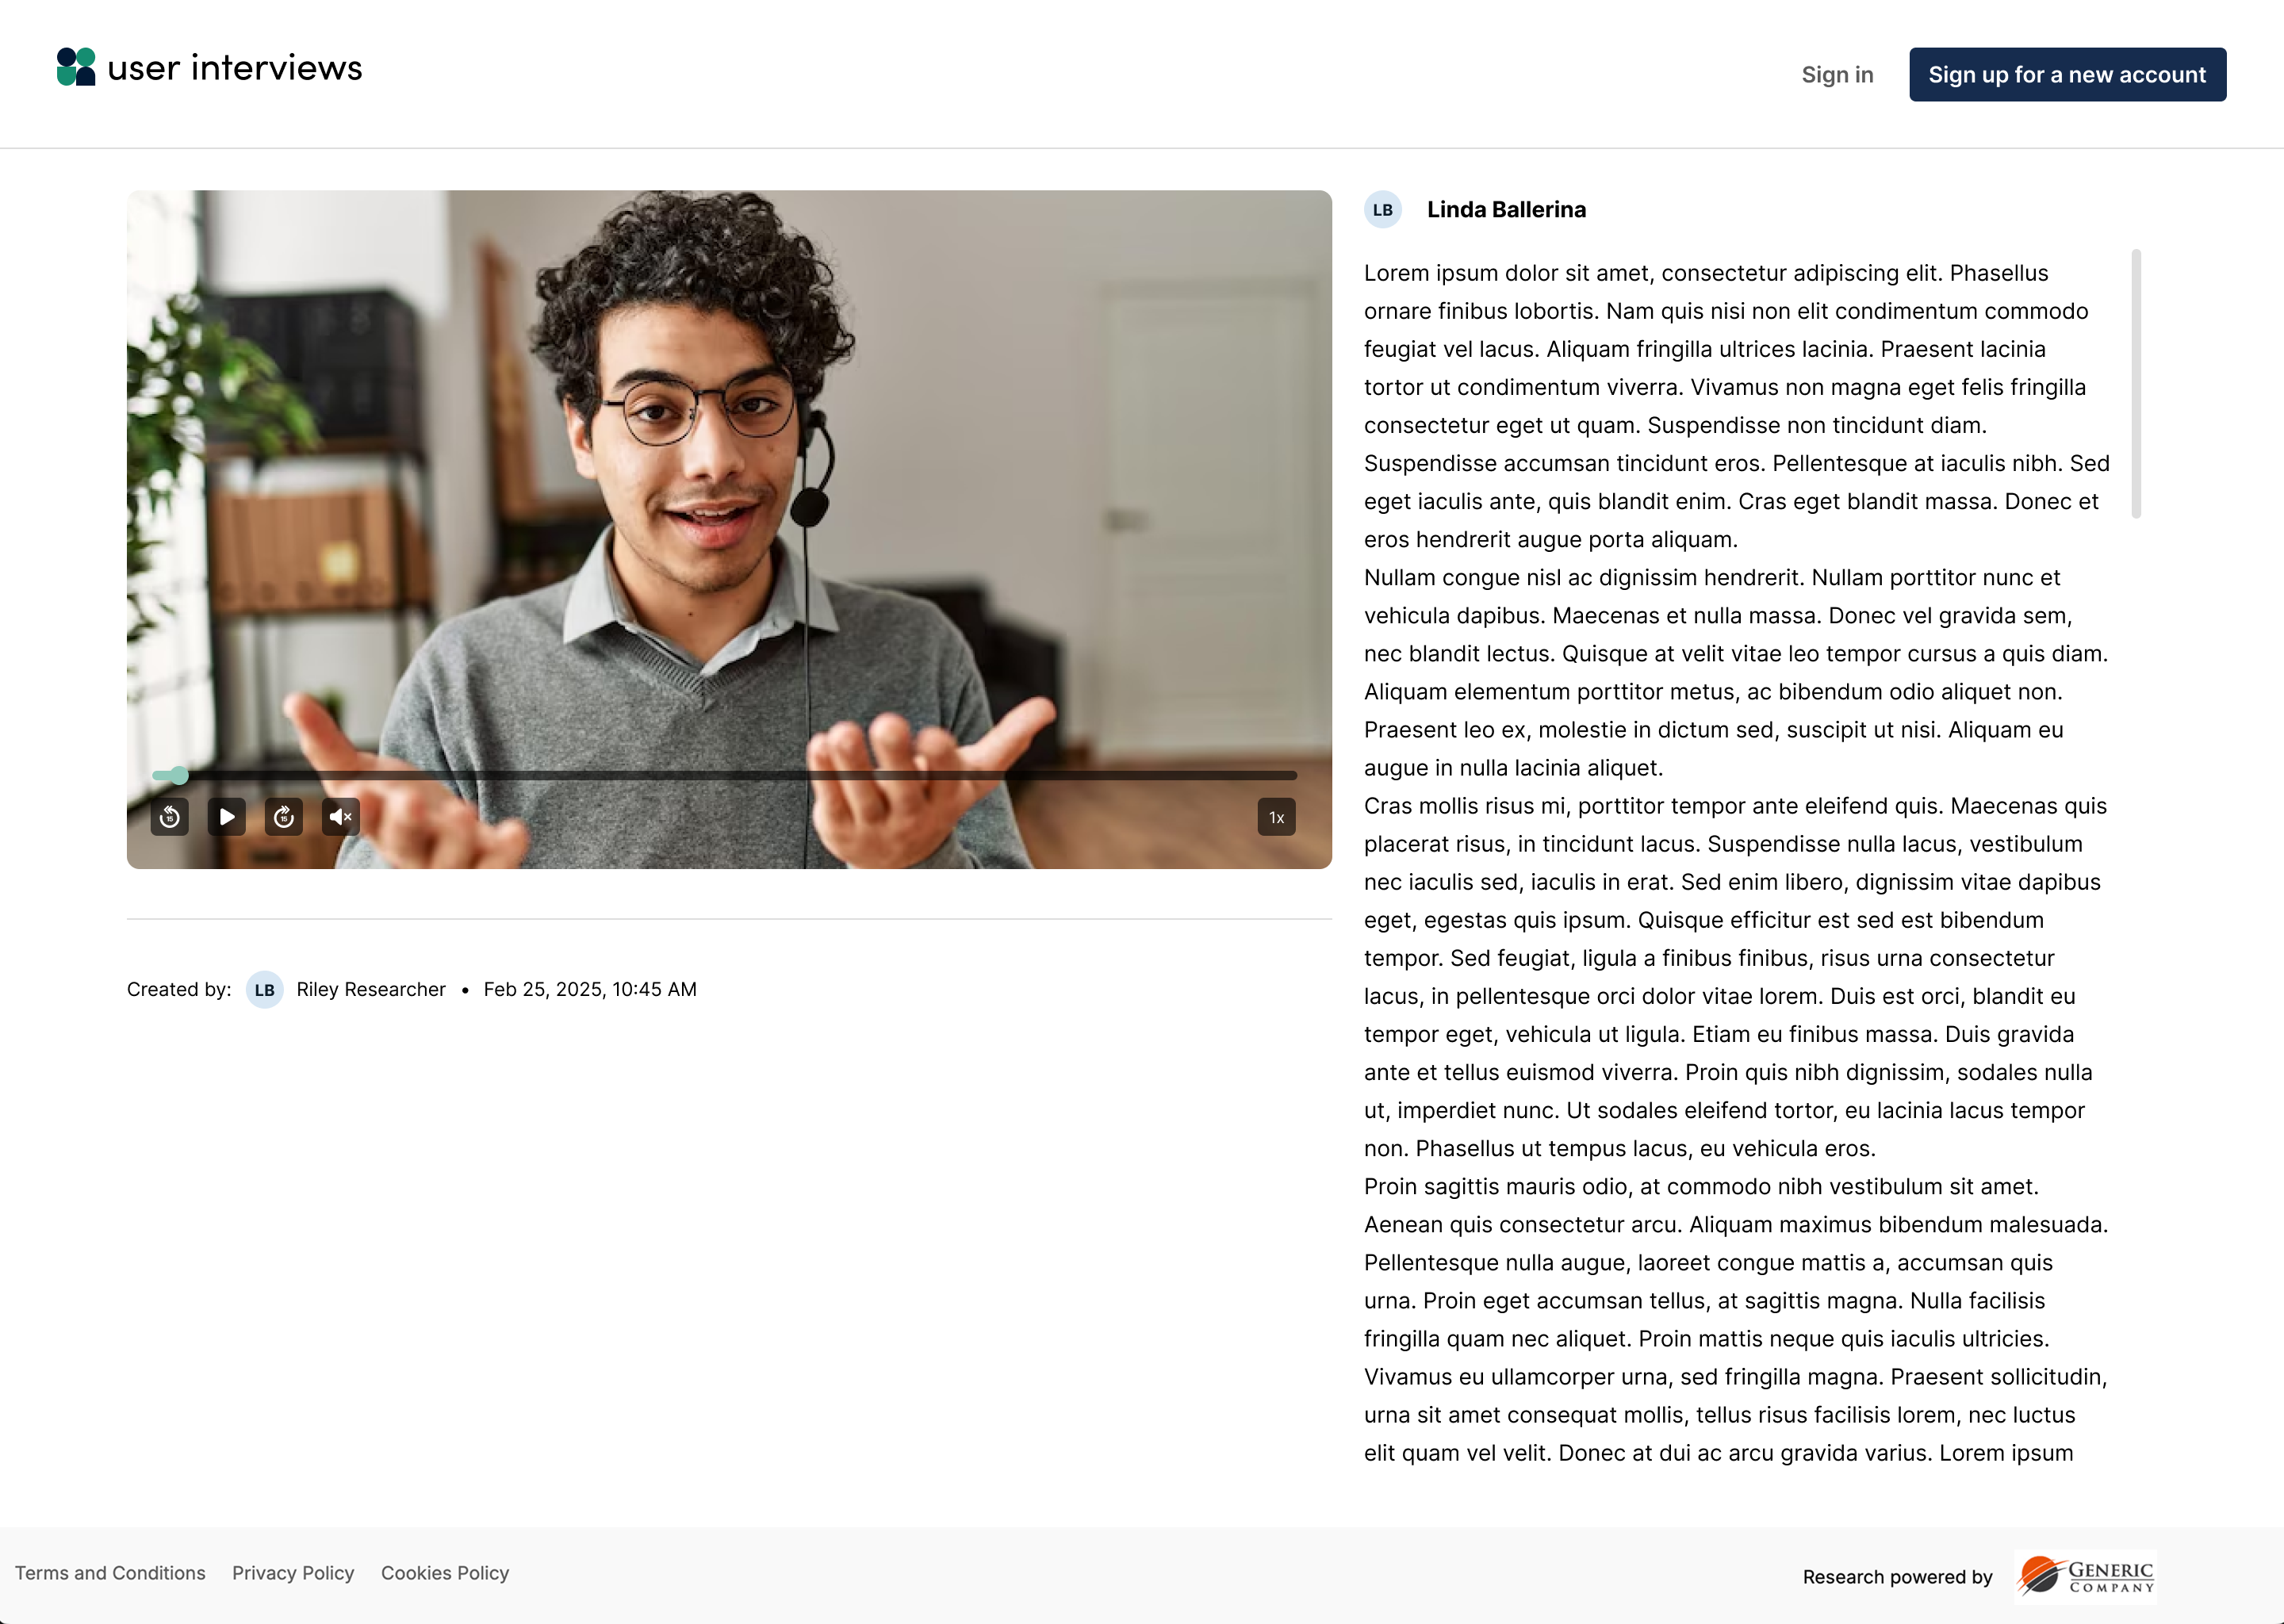
To share clips, you can either copy and paste the link, or download the clip as an MP4. This flexibility allows you to easily work in multiple systems and create stakeholder-ready materials. Since clips are accessible from an individual page, you can share clips regardless of whether someone has a UI account.
Best practices for using clips
To get the most impact out of your clips, be sure to:
- Keep clips short (30–90 seconds)
- Pair clips with their context
- Confirm participant consent before sharing externally
- Combine sets of clips organized around research themes
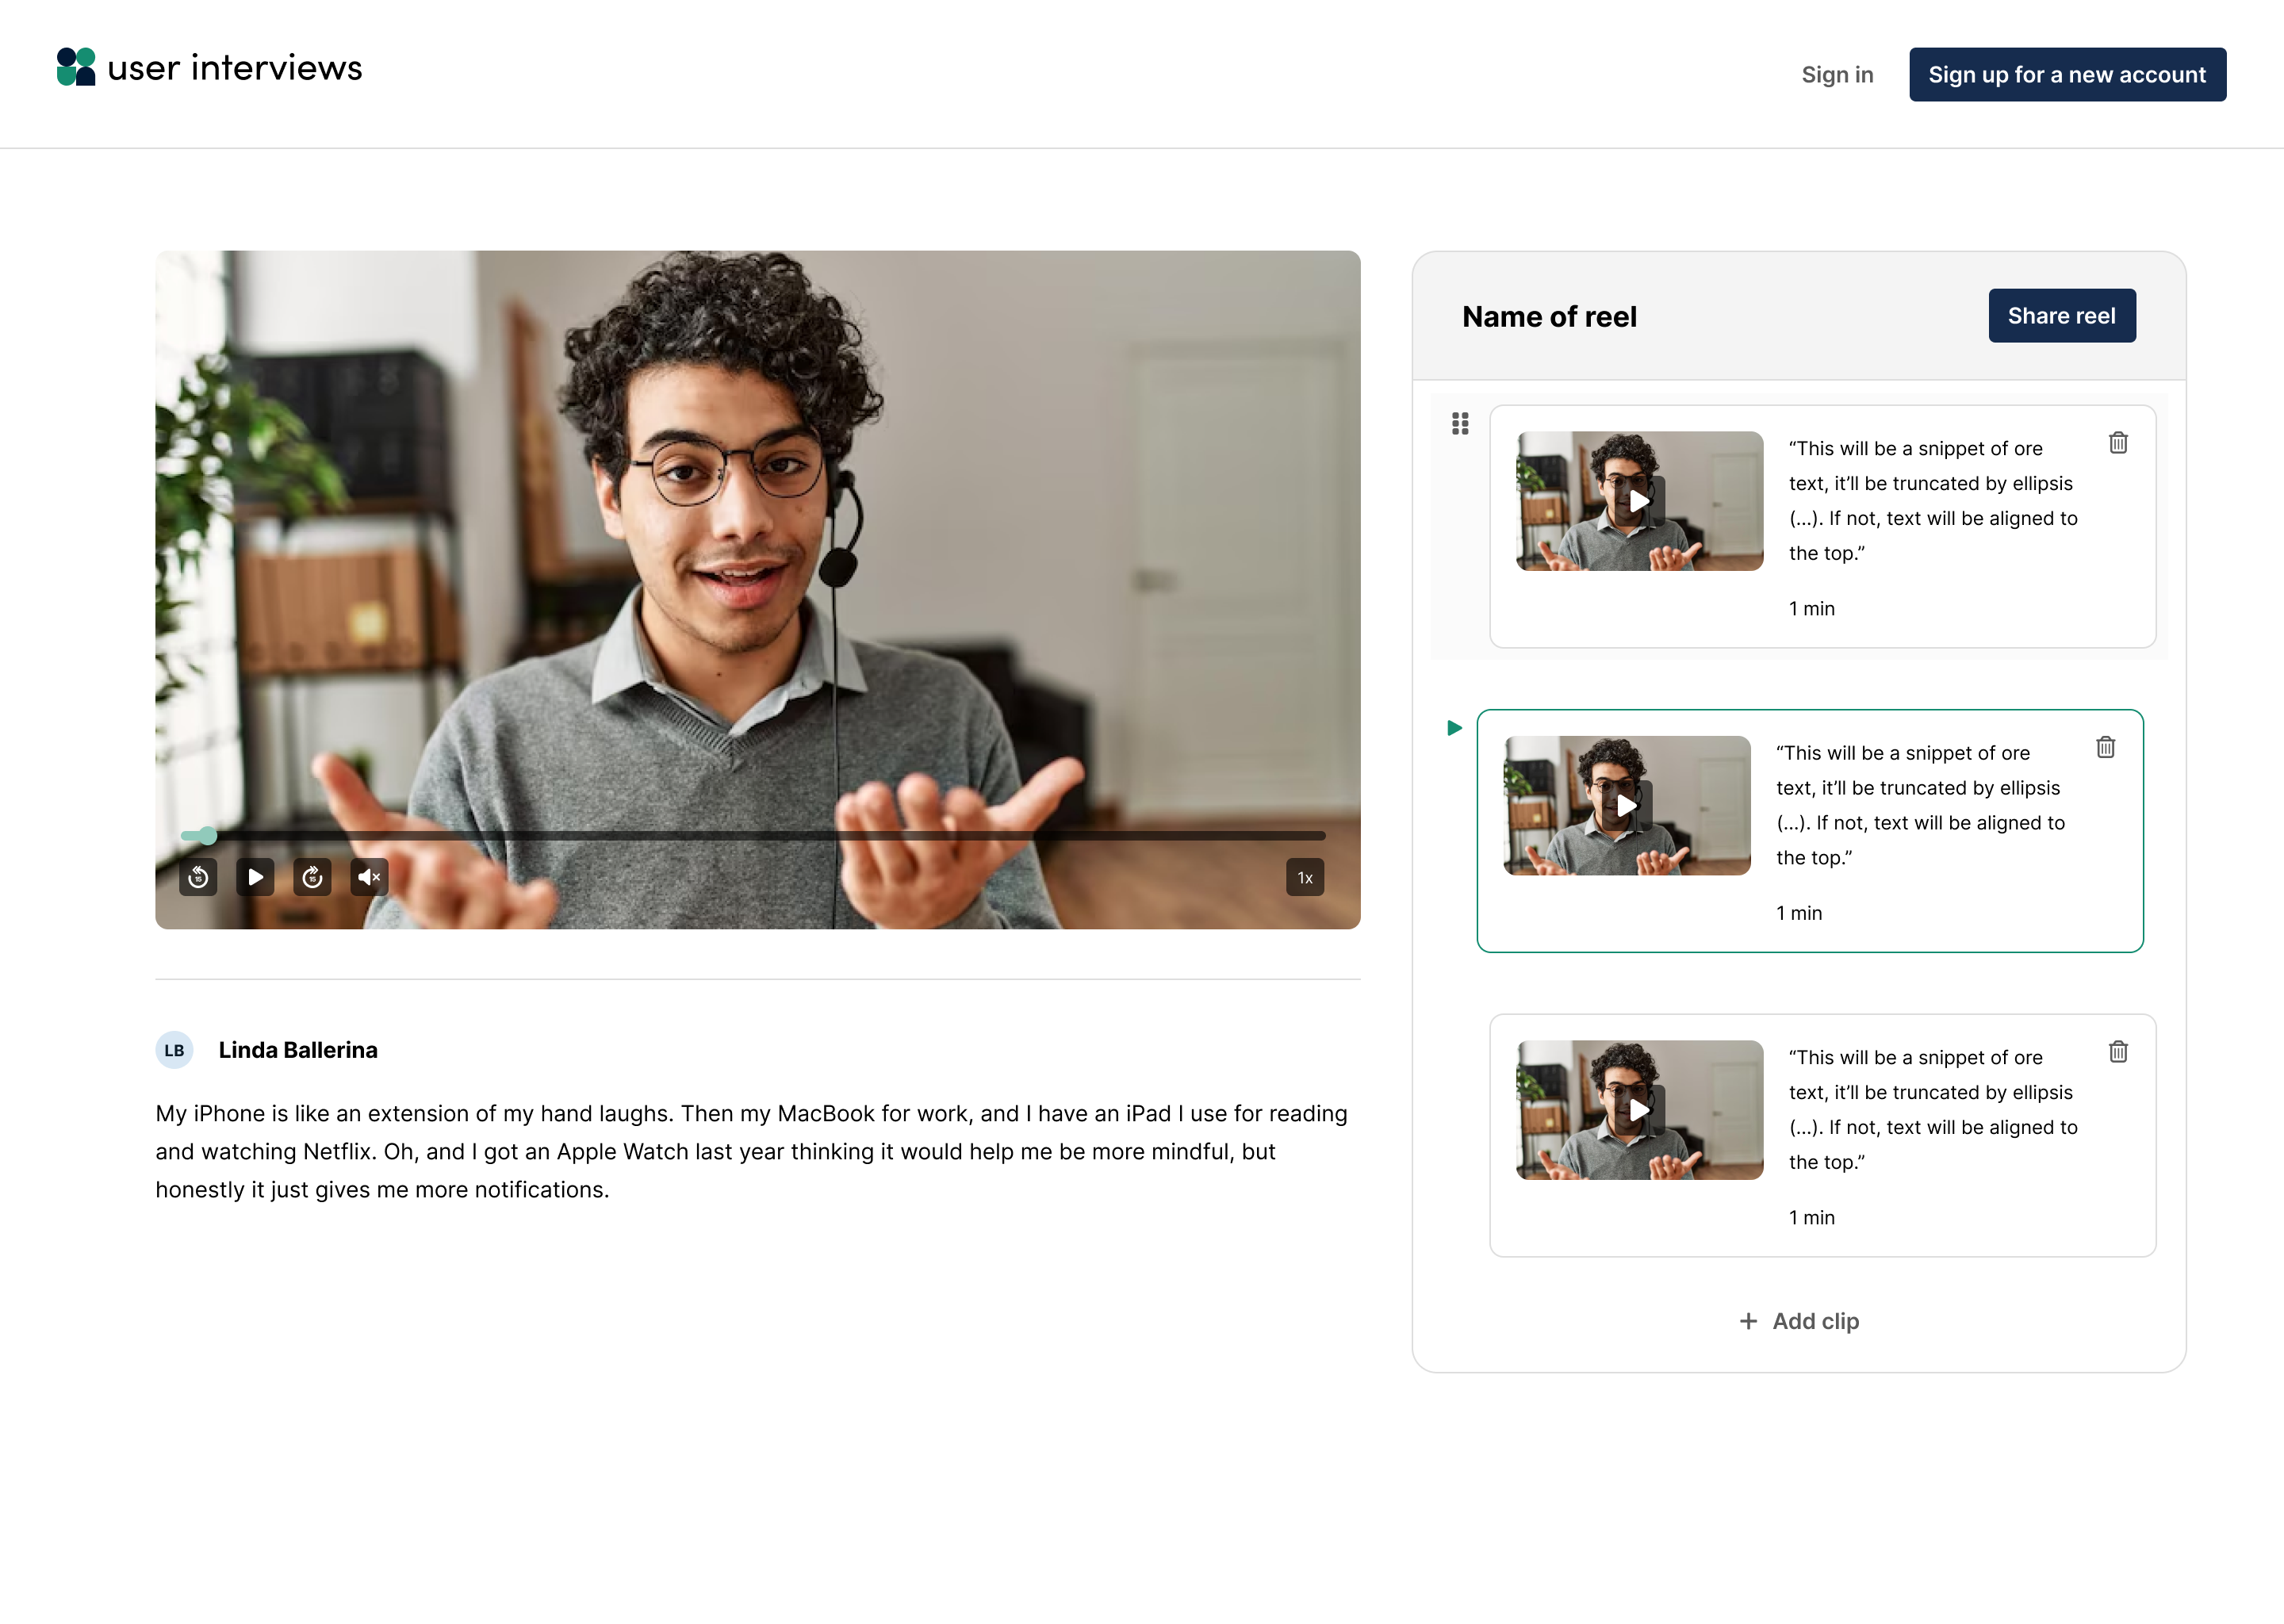
Creating Reels
Group multiple clips into a named, shareable reel. Easily present insights, highlight key moments, and share findings without requiring viewers to have a User Interviews account.
- Create reels from any session: Pull together clips from across your project into a single reel
- Drag-and-drop ordering: Arrange clips to control the flow and narrative
- Public sharing: Share via a public link—no login required. Viewers can watch clips back-to-back in a seamless experience
- Reuse clips across reels: Use the same clip in multiple reels to tailor stories for different audiences
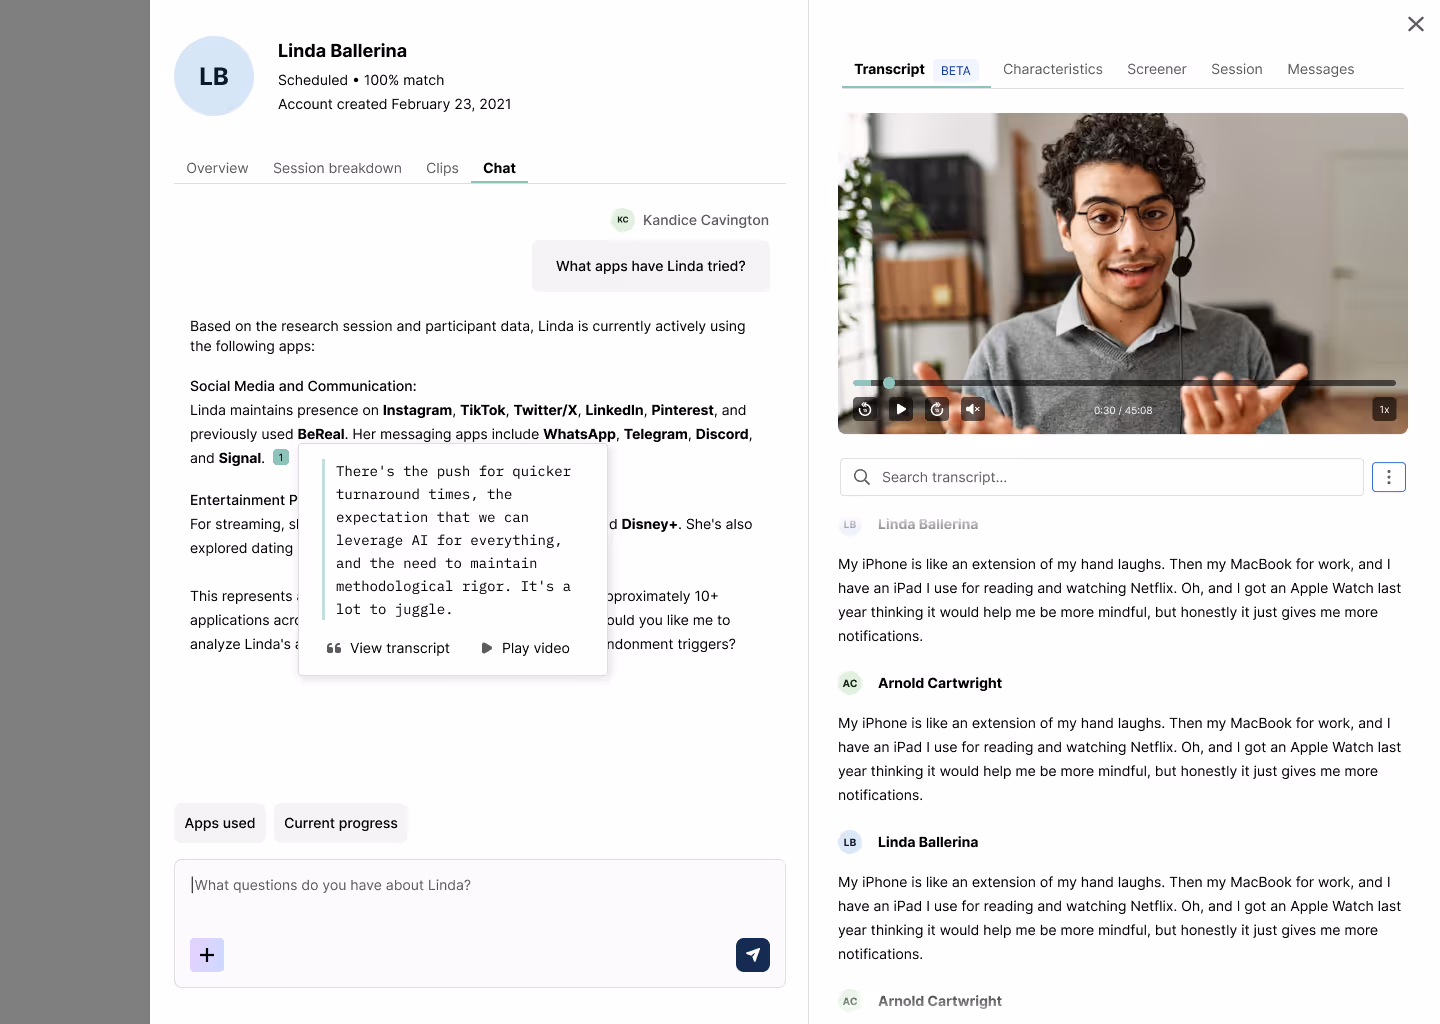
AI Chat Mode
AI Chat lets you ask natural language questions and get cited answers back instantly for deep research. It’s a quick way to explore a session during research analysis: confirm an idea, find a specific quote, check whether a theme came up in conversation, and more.
Watch it in Action
When you ask a question in AI chat, it gives an answer and cites the specific parts of the transcript it’s pulling from. You can click on any citation to see the quote and jump directly to that part in the transcript.
You can ask questions like:
- What were this participant’s major pain points?
- What did they say about onboarding?
- Did they comment on pricing or competitors?
🛡️ AI chat only uses what the participant said in the session. It doesn’t pull in researcher comments or any outside sources.
Use participant-level chat when you want to deeply explore one session.
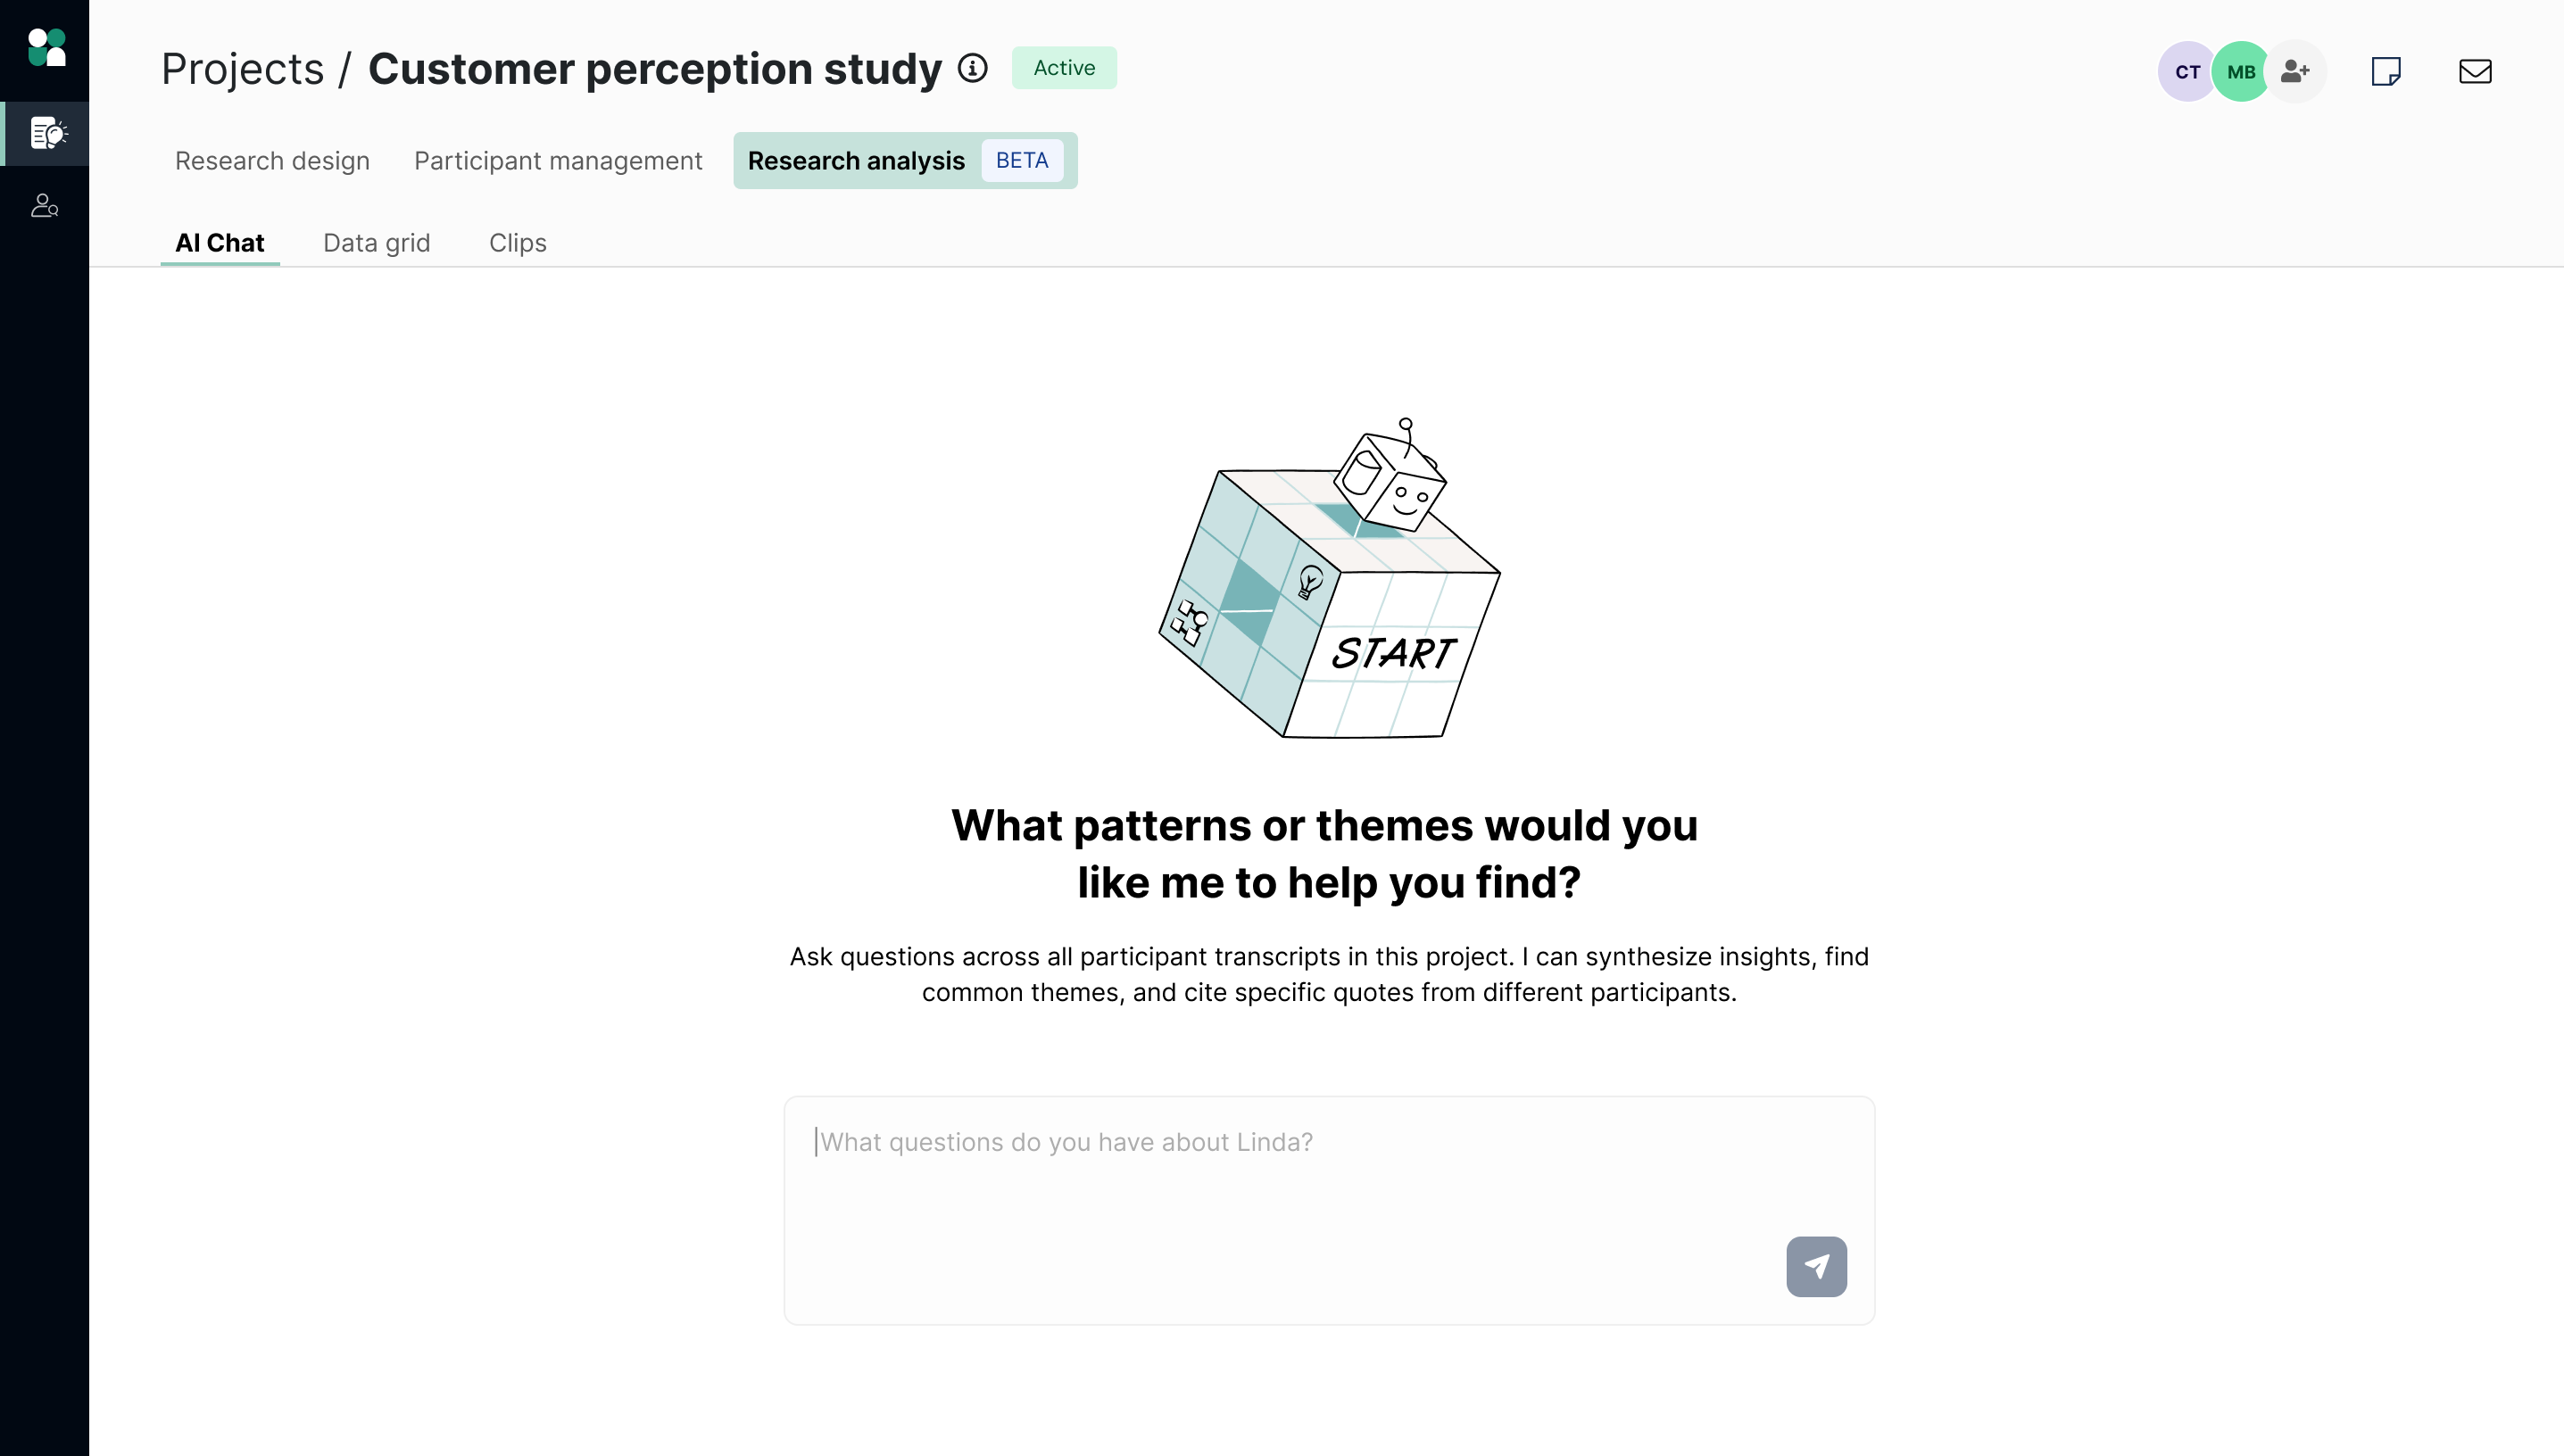
Use project-level chat when you want to identify themes, patterns, contradictions, or supporting evidence across all participants.
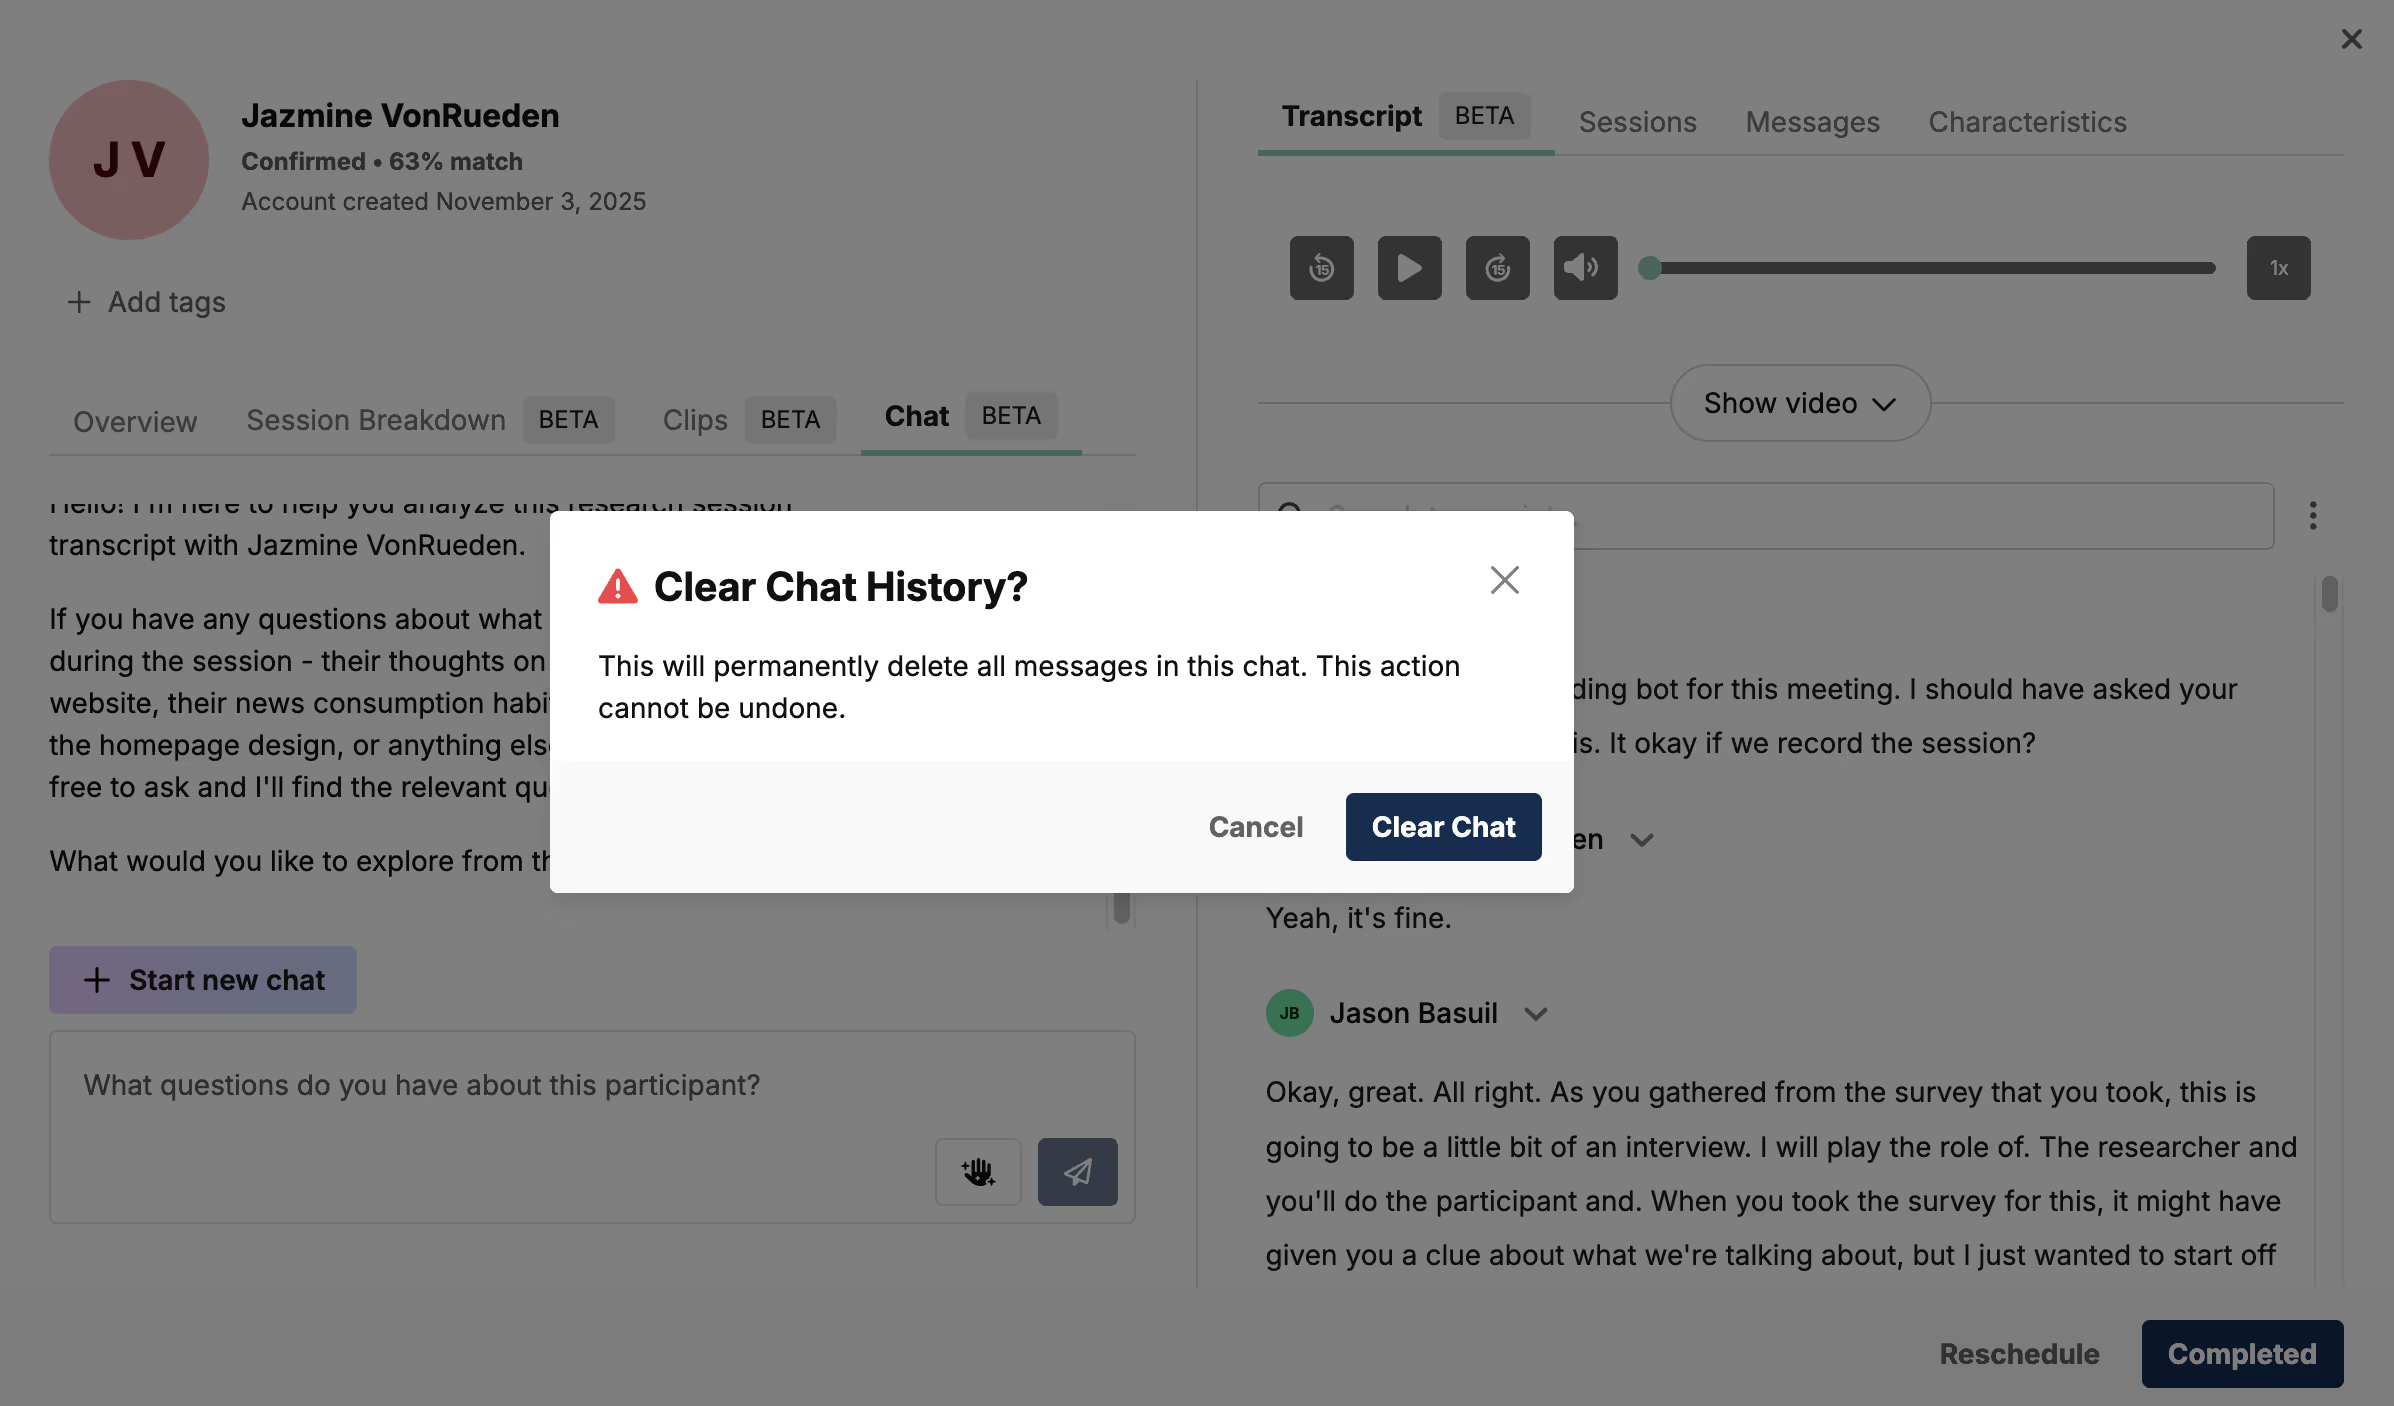
Click the “+Start a new chat” button if you’d like to start a fresh conversation. Note that this will permanently clear your previous chat history.
FAQ
Who can use this feature?
Only teams with AI functionality turned on will have access. Admins can manage this setting at the organizational level.
What participant data can I add to the data grid?
You can layer any participant data that will add context for your analysis, such as screener questions, professional or demographic characteristics, and more. Use the search bar to select which columns to display.
Are the observations in the data grid the same observations as those in the session breakdown?
Yes, we pull the exact AI generated observations from the session breakdowns into the data grid so they can be easily viewed together in one place.
Why don’t I see anything in the Research Analysis area?
You may not have any sessions with recordings or transcripts yet! First, make sure your team has AI functionality turned on (admins can manage this setting at the organizational level)
Next, make sure to enable recordings and upload your discussion guide to your project—this will enable session breakdowns and populate the data grid with insights.
Can I export the data grid?
Yes, you can download the entire data grid as a csv file. When you export, all the automatically generated information from the session breakdowns will be included—tags, summary, sentiment, and any custom columns you have added.
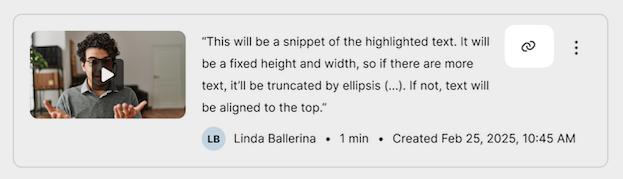
How do I share specific clips with my team?
Select a clip and click “Copy link to clip” from the menu. This will link to the specific participant drawer and show the transcript at the timestamp of that clip, with the text highlighted and the video ready to be played.
Does AI chat save my conversation history?
Yes, the history of your current chat will be saved. If you choose to start a new chat, this will permanently clear the previous chat history.
Can I use AI chat across sessions?
Currently, each chat session is specific to one participant and doesn’t pull in data across other sessions (project-level chat is coming soon!)


