
Survicate conducted research on NPS, analyzing data from 599 companies that ran 2,187 NPS surveys. The data showed that:
- NPS scores reflect structural context rather than real customer experience
- Often teams misread this score as a product signal rather than double click into important context, such as B2B vs B2C business models
The article provides insights on how teams can stop treating NPS as a strategy and start treating it as one of the signals within their research system.
You’ve just run your NPS survey, and you see a score of 38. If your stakeholders asked you if it's a good score, what should you tell them?
Well, it’s complicated: if your answer is based only on an industry benchmark, you might be missing the reality check that this result doesn’t always reflect how good your product is.
As NPS (aka Net Promoter Score) is one of the few metrics researchers share with leadership and stakeholders directly, the number you share has to be interpreted correctly to reflect the reality of your company and make an impact.

The team at Survicate recently analyzed data across hundreds of companies to unpack what NPS should mean for you, and as important, how you can best share that nuance with stakeholders.
For our research, we analyzed data from 599 companies that ran 2,187 NPS surveys, collecting over 5.4 million responses in 2025. The biggest revelation wasn’t the highest scores by industry. It was that NPS scores reflect structural context rather than real customer experience, and that often teams misread this score as a product signal rather than double click into important context, such as business model.
For instance, our study showed that the median NPS score across all industries and business models is 42. However, when you break it down by business model, you get an 11-point gap: 49 for B2C companies and 38 for B2B organizations.
This gap is consistent across industries and across other major benchmarks. Does it mean that B2C companies are delivering better service? Not exactly.

Knowing where your business sits in a given industry x business model matrix matters more than comparing yourself to an overall average. However, benchmarking correctly solves only part of the problem.
Why Does Your NPS Score Look Better (or Worse) in a B2B vs B2C Context?
“How likely are you to recommend us to a friend or colleague?”
When answering this question in a B2C context, the respondent often feels personal ownership over the product they are rating. In a professional context, they usually don’t.
There are several explanations for this B2B/B2C gap. Most teams stop at the surface, when they should go one layer deeper, into how differently people feel about the products they chose for their everyday life versus products they use for business purposes.
This comes down to four primary reasons:
- Complex workflows. B2B software must integrate with existing technology stacks, serve multiple user roles simultaneously, and satisfy both the buyer and the end user (who are often different people). B2C businesses usually serve simpler use cases.
- Higher stakes, lower tolerance. When business software fails, it affects workflows, operations, and revenue. As a result, tolerance for imperfection is lower and results in lower NPS.
- The buyer vs end user split. Most of the time, the person who responds to the NPS survey is not the person who chose the product – they simply inherited it. Gainsight’s Customer Success Index found a 10-point NPS gap between executive buyers (median 46) and end users (median 36) within the same B2B organizations. If your survey goes to an audience of both buyers and users, you’re mixing together two groups with different relationships to the product.
- Giving a 9 or 10 carries professional weight. Recommending something to a colleague is different from recommending it to a friend. Recommending a hotel you loved to a friend is low stakes. Recommending a CRM to your Sales Director, where a failed migration reflects on your judgment, is not. This asymmetry pushes B2B NPS scores down even when the product is good and the user is genuinely happy.
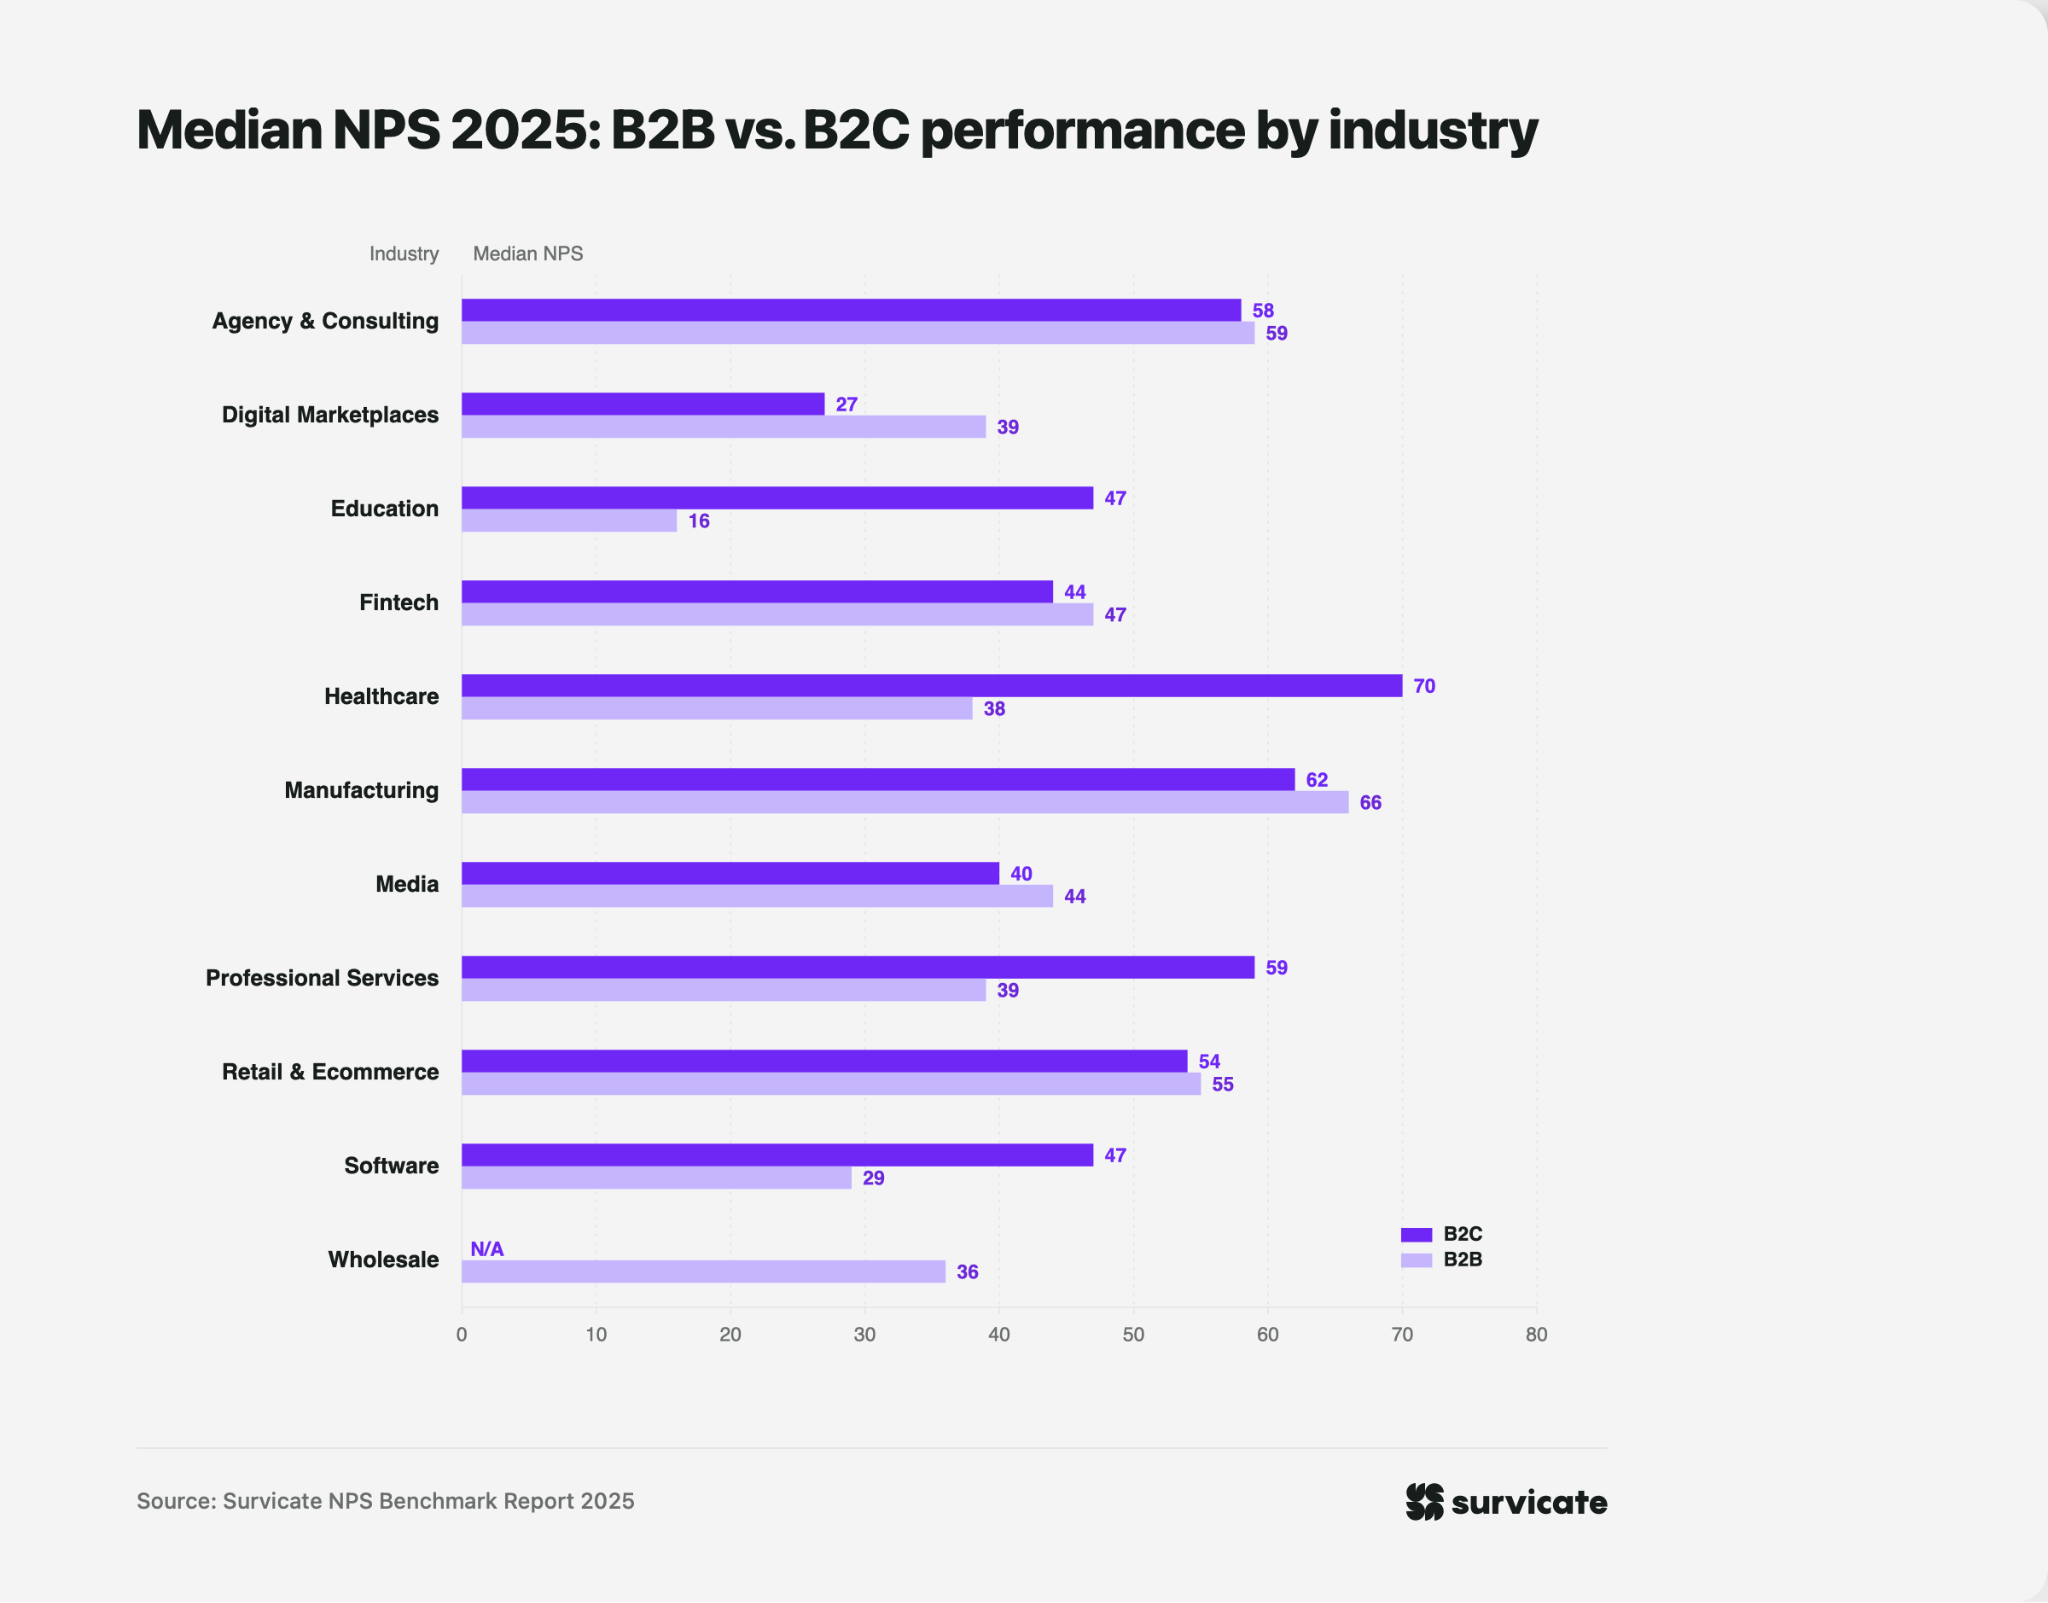
Our research found that B2C software scores a median of 47 in our data, while B2B software scores 29 – a significant 18-point gap within a single industry. If you’re a researcher at a B2B software company benchmarking against an industry average, you’re comparing yourself to a user base where some part of the respondents have a different relationship to the product they’re rating.

However, knowing what benchmark to compare to solves just one problem. Even a correctly interpreted score tells you only where you stand, not why you're there, what is happening in your product, and what to do next.
How Researchers Can Ensure NPS is an Actionable Insight
There’s a bigger question researchers should be asking than “how do we improve our NPS?”, but rather, "Is NPS alone the right tool for what we want to learn?"
“NPS is an isolated metric,” says Eylul Nowakowska Beyazit, CX and Sales Director at Survicate. “By the time your score reflects a problem, the conditions that created it happened months ago. A number on its own doesn’t tell you where in the customer journey things went wrong, or what you should do differently.”

Teams should stop treating NPS as a strategy and start treating it as one of the signals within their research system. In practice, this means four things:
- Match the survey to a research question. Onboarding, first value, mid-cycle, renewal, churn – each stage has a different question worth asking. Before sending anything, understand what you're trying to learn and what decision the score will inform.
- Segment first, interpret second. New and experienced users, buyers and end-users will give you different scores for reasons unrelated to their satisfaction with your product. The key signal is usually in the breakdown, not in the general number.
- Use NPS as a signal to investigate. A drop of a score means something is wrong, but it won’t tell you what unless you ask a follow-up question. Treat it as a starting point of your discovery questions, not the finding itself.
- Connect signals across the journey. A single score tells you how someone felt at one moment. Patterns across multiple touchpoints will tell you where the experience consistently breaks down – an insight worth sharing with your stakeholders.
The most useful thing you can tell your stakeholders isn’t “our NPS is 38.” It’s “our score is 38, which is above the median for our business model and user type, and it’s been trending up for two quarters.” That’s what turns NPS from a number you report on into a system you can act on.
Further reading