Watch our Product Talk Webinars for a quarterly preview of new features
We’ve been working on AI-powered research analysis within User Interviews, a powerful new way to go from raw conversations to clear, sharable insights.
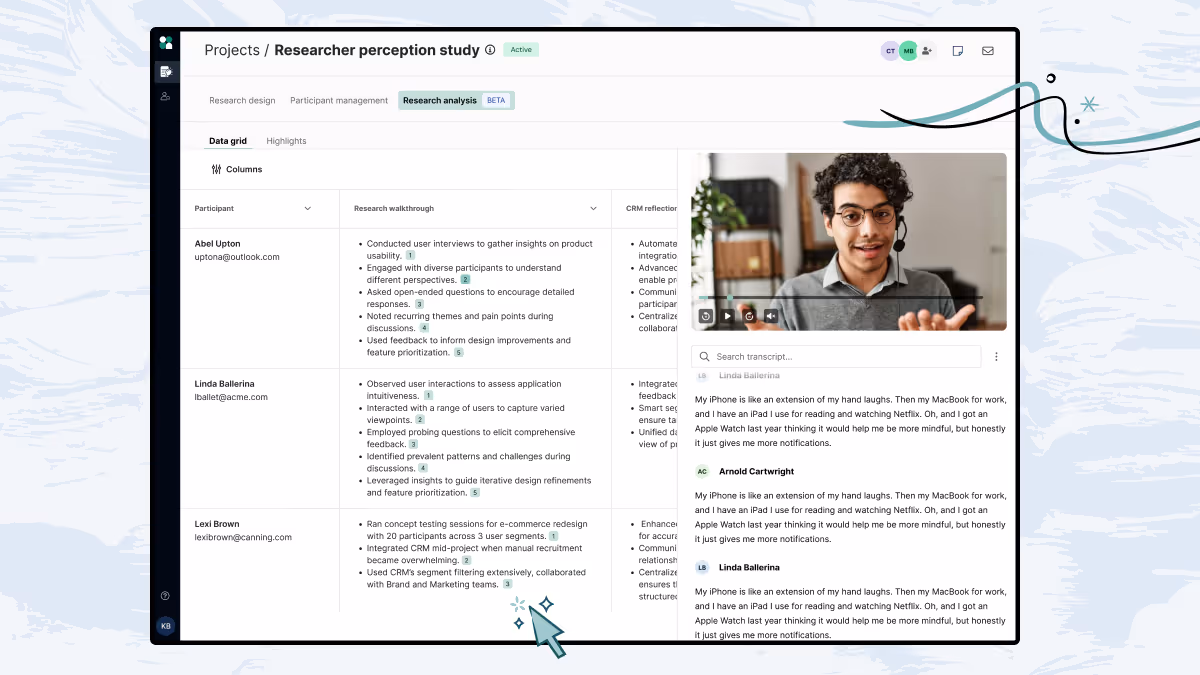
With recordings, high-quality transcripts, AI-generated observations, and now the Data grid in a new Research Analysis area of the workspace, you can speed up post-session analysis and extract insights faster than ever. Everything lives together so it’s easy to connect the dots across interviews, participants, and projects.
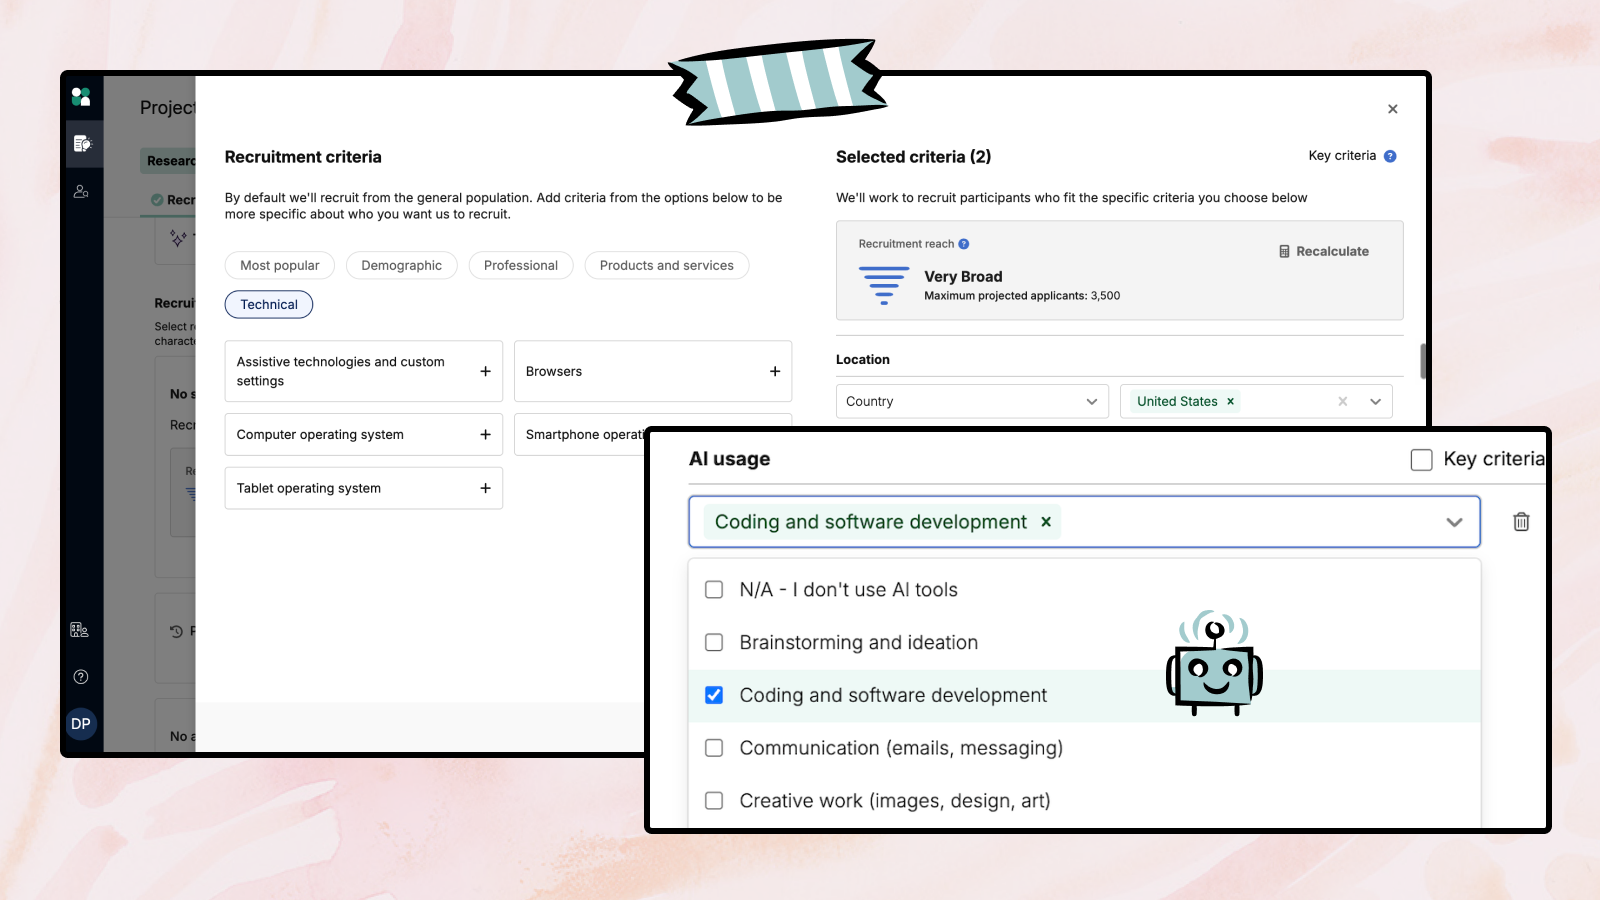
Easily compare responses across participants alongside screener responses, characteristics, and any other audience data for richer, more segmented analysis. You can pull in as much participant or project data as you’d like, just click to add columns and select the ones you’d like to display in the data grid.
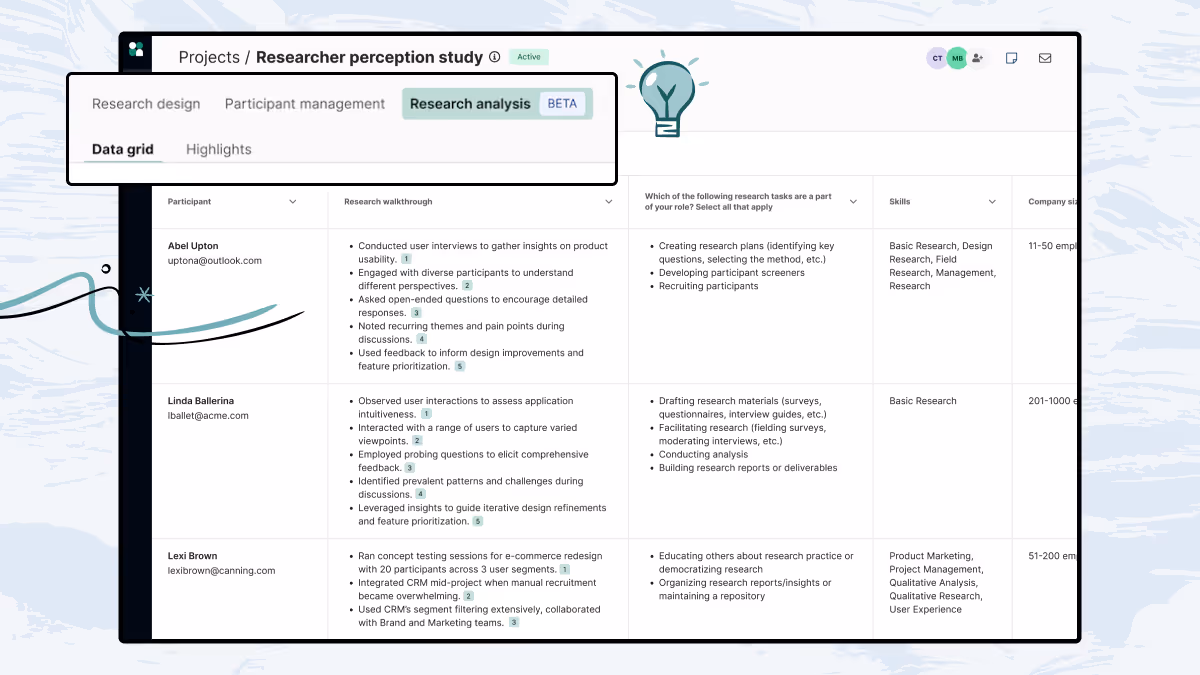
Click a citation to jump straight to the exact location in the transcript that generated an observation—keeping every insight traceable and trustworthy. You can also copy observations in one click and paste into other tools for further analysis.
Learn more about how to get started in our support guide 👉


Join over 100,000 subscribers and get the latest articles, reports, podcasts, and special features delivered to your inbox, every week.

Schedule your demo and see us in action today.